• 文献检索
  • 文档翻译
  • 深度研究
  • 学术资讯
  • Suppr Zotero 插件Zotero 插件
  • 邀请有礼
  • 套餐&价格
  • 历史记录
应用&插件
Suppr Zotero 插件Zotero 插件浏览器插件Mac 客户端Windows 客户端微信小程序
定价
高级版会员购买积分包购买API积分包
服务
文献检索文档翻译深度研究API 文档MCP 服务
关于我们
关于 Suppr公司介绍联系我们用户协议隐私条款
关注我们

Suppr 超能文献

核心技术专利:CN118964589B侵权必究
粤ICP备2023148730 号-1Suppr @ 2026

文献检索

告别复杂PubMed语法,用中文像聊天一样搜索,搜遍4000万医学文献。AI智能推荐,让科研检索更轻松。

立即免费搜索

文件翻译

保留排版,准确专业,支持PDF/Word/PPT等文件格式,支持 12+语言互译。

免费翻译文档

深度研究

AI帮你快速写综述,25分钟生成高质量综述,智能提取关键信息,辅助科研写作。

立即免费体验

1990 年至 2018 年期间,185 个国家成年人的含糖饮料摄入量。

Sugar-sweetened beverage intakes among adults between 1990 and 2018 in 185 countries.

机构信息

Friedman School of Nutrition Science and Policy, Tufts University, Boston, MA, USA.

University of Thessaly, Volos, Greece.

出版信息

Nat Commun. 2023 Oct 3;14(1):5957. doi: 10.1038/s41467-023-41269-8.

DOI:10.1038/s41467-023-41269-8
PMID:37788998
原文链接:https://pmc.ncbi.nlm.nih.gov/articles/PMC10614169/
Abstract

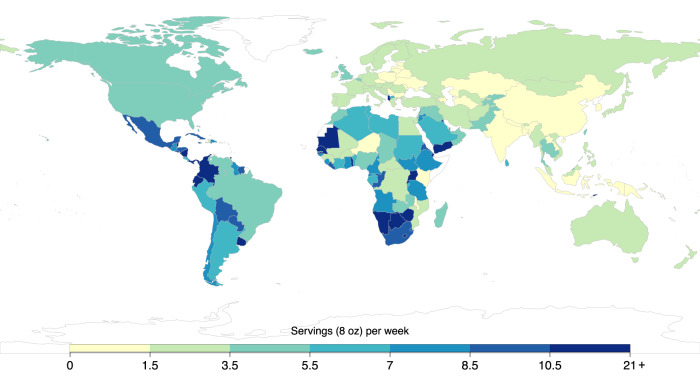
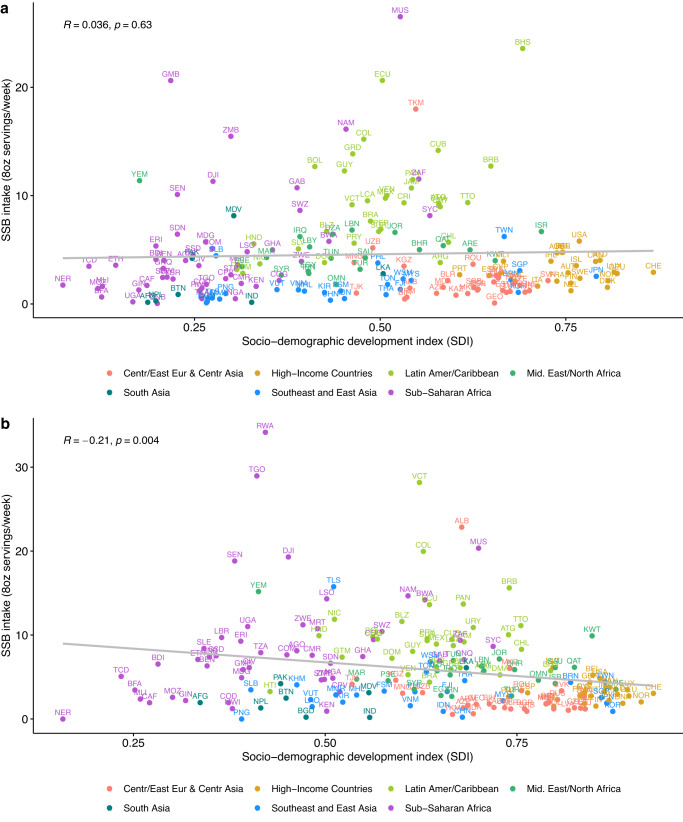
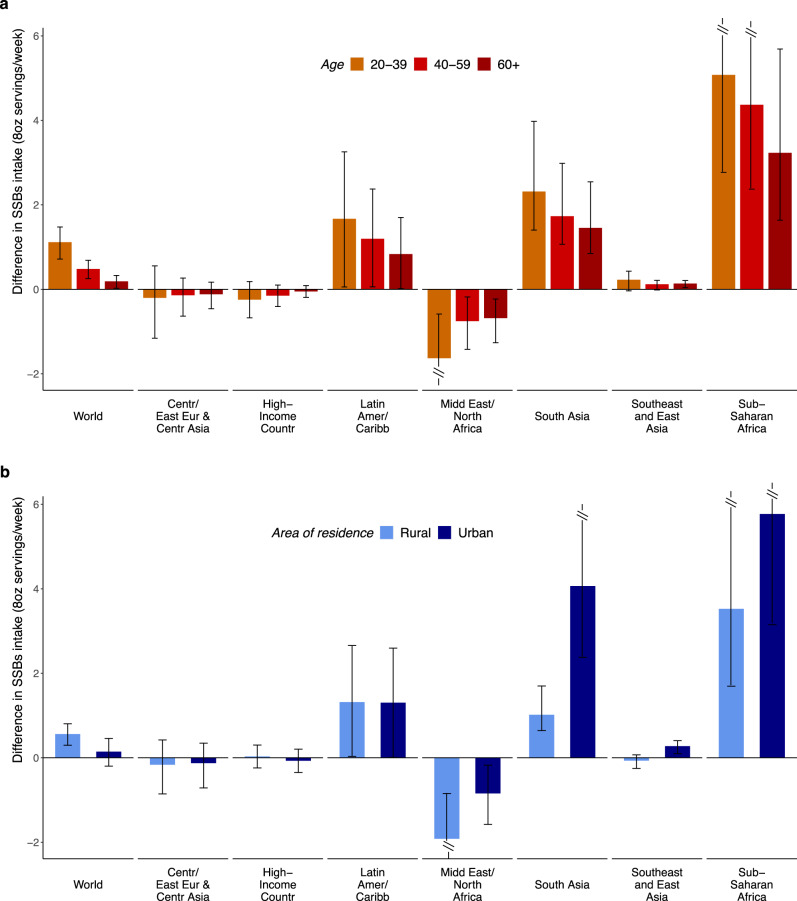
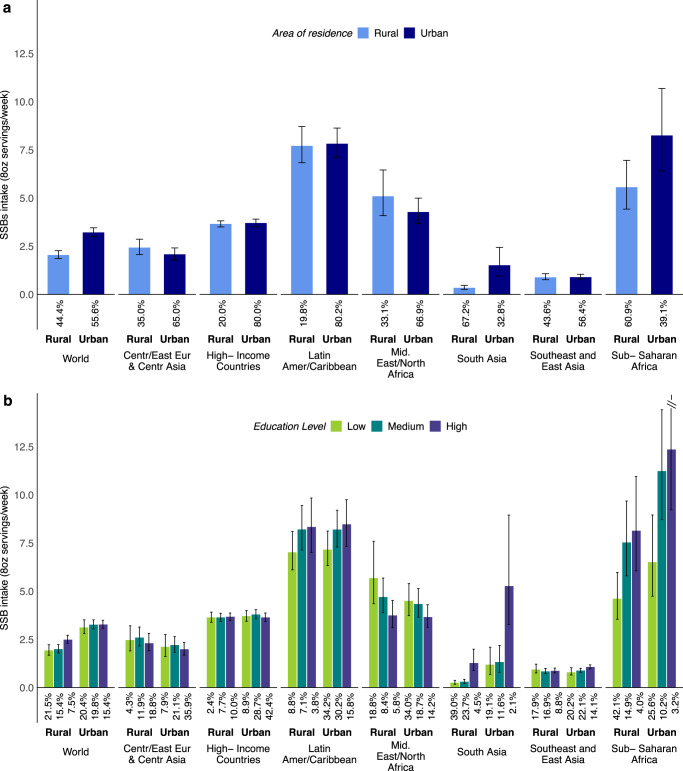
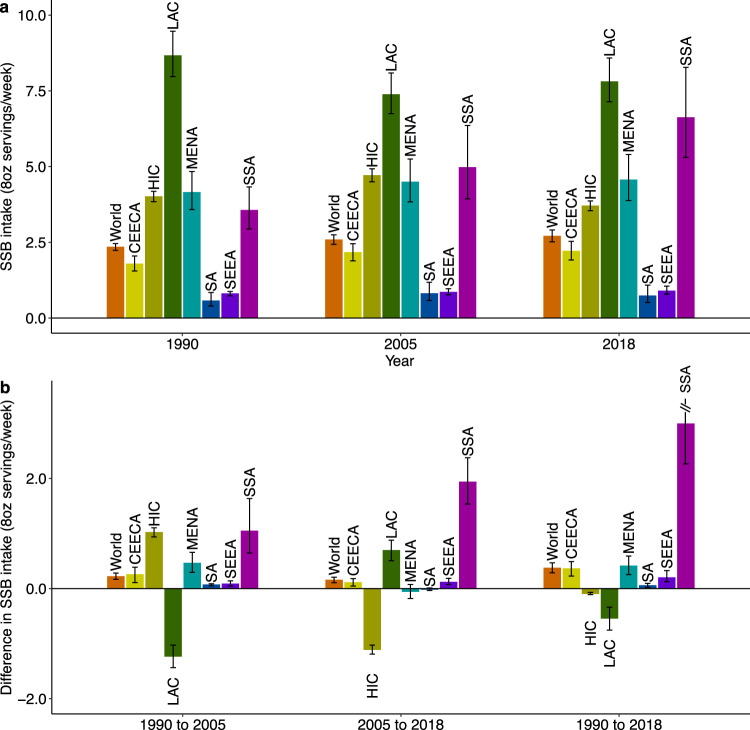
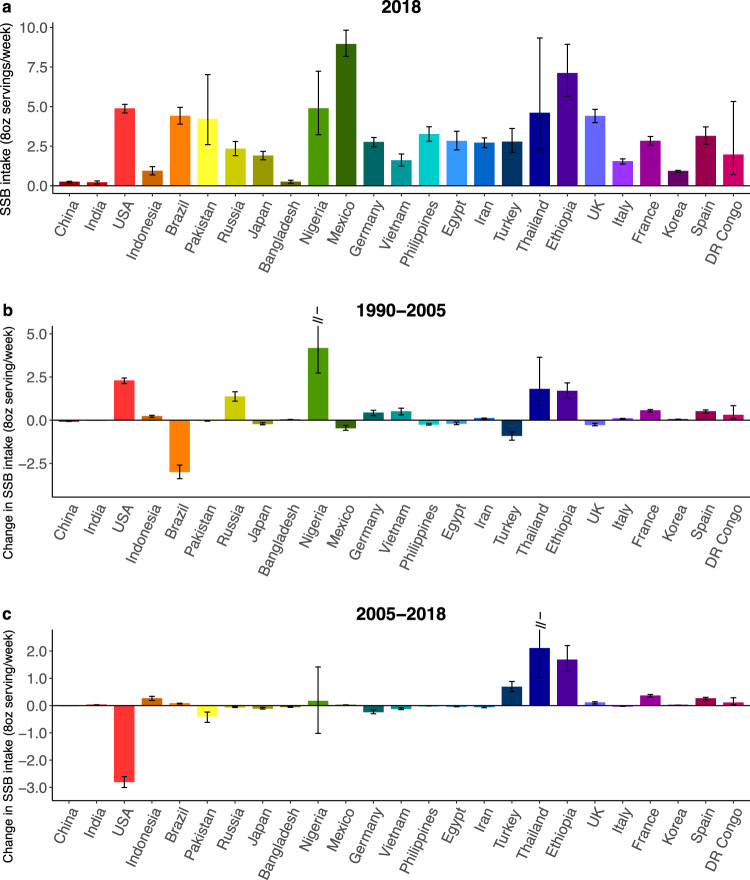
Sugar-sweetened beverages (SSBs) are associated with cardiometabolic diseases and social inequities. For most nations, recent estimates and trends of intake are not available; nor variation by education or urbanicity. We investigated SSB intakes among adults between 1990 and 2018 in 185 countries, stratified subnationally by age, sex, education, and rural/urban residence, using data from the Global Dietary Database. In 2018, mean global SSB intake was 2.7 (8 oz = 248 grams) servings/week (95% UI 2.5-2.9) (range: 0.7 (0.5-1.1) in South Asia to 7.8 (7.1-8.6) in Latin America/Caribbean). Intakes were higher in male vs. female, younger vs. older, more vs. less educated, and urban vs. rural adults. Variations by education and urbanicity were largest in Sub-Saharan Africa. Between 1990 and 2018, SSB intakes increased by +0.37 (+0.29, +0.47), with the largest increase in Sub-Saharan Africa. These findings inform intervention, surveillance, and policy actions worldwide, highlighting the growing problem of SSBs for public health in Sub-Saharan Africa.

摘要

含糖饮料(SSB)与心血管代谢疾病和社会不平等有关。对于大多数国家来说,最近的摄入量估计和趋势都不可用;也没有按教育程度或城市/农村居住情况进行划分。我们使用全球饮食数据库中的数据,在 185 个国家/地区,按年龄、性别、教育程度和城乡居住情况进行分层,调查了 1990 年至 2018 年期间成年人的 SSB 摄入量。2018 年,全球 SSB 摄入量的平均值为每周 2.7(8 盎司=248 克)份(95%UI 2.5-2.9)(范围:南亚为 0.7(0.5-1.1),拉丁美洲/加勒比为 7.8(7.1-8.6))。男性比女性、年轻人比老年人、受教育程度高的人比受教育程度低的人、城市居民比农村居民的摄入量更高。撒哈拉以南非洲的教育程度和城乡差异最大。1990 年至 2018 年,SSB 摄入量增加了+0.37(+0.29,+0.47),撒哈拉以南非洲的增幅最大。这些发现为全球的干预、监测和政策行动提供了信息,突显了 SSB 对撒哈拉以南非洲公共卫生日益严重的问题。

https://cdn.ncbi.nlm.nih.gov/pmc/blobs/b413/10614169/439fcdfb245f/41467_2023_41269_Fig8_HTML.jpg
https://cdn.ncbi.nlm.nih.gov/pmc/blobs/b413/10614169/bddae94282b0/41467_2023_41269_Fig1_HTML.jpg
https://cdn.ncbi.nlm.nih.gov/pmc/blobs/b413/10614169/fc828c504f66/41467_2023_41269_Fig2_HTML.jpg
https://cdn.ncbi.nlm.nih.gov/pmc/blobs/b413/10614169/cc195b30b976/41467_2023_41269_Fig3_HTML.jpg
https://cdn.ncbi.nlm.nih.gov/pmc/blobs/b413/10614169/9c1f575a0717/41467_2023_41269_Fig4_HTML.jpg
https://cdn.ncbi.nlm.nih.gov/pmc/blobs/b413/10614169/12a6bf67a00b/41467_2023_41269_Fig5_HTML.jpg
https://cdn.ncbi.nlm.nih.gov/pmc/blobs/b413/10614169/f04b47c3a2cf/41467_2023_41269_Fig6_HTML.jpg
https://cdn.ncbi.nlm.nih.gov/pmc/blobs/b413/10614169/042071678a82/41467_2023_41269_Fig7_HTML.jpg
https://cdn.ncbi.nlm.nih.gov/pmc/blobs/b413/10614169/439fcdfb245f/41467_2023_41269_Fig8_HTML.jpg

相似文献

1
Sugar-sweetened beverage intakes among adults between 1990 and 2018 in 185 countries.1990 年至 2018 年期间,185 个国家成年人的含糖饮料摄入量。
Nat Commun. 2023 Oct 3;14(1):5957. doi: 10.1038/s41467-023-41269-8.
2
Intake of sugar sweetened beverages among children and adolescents in 185 countries between 1990 and 2018: population based study.1990 年至 2018 年 185 个国家儿童和青少年摄入含糖饮料情况:基于人群的研究。
BMJ. 2024 Aug 7;386:e079234. doi: 10.1136/bmj-2024-079234.
3
Global, Regional, and National Consumption of Sugar-Sweetened Beverages, Fruit Juices, and Milk: A Systematic Assessment of Beverage Intake in 187 Countries.全球、区域和国家层面的含糖饮料、果汁及牛奶消费量:对187个国家饮料摄入量的系统评估
PLoS One. 2015 Aug 5;10(8):e0124845. doi: 10.1371/journal.pone.0124845. eCollection 2015.
4
Sugar-Sweetened Beverage Consumption in Adults: Evidence from a National Health Survey in Peru.成人含糖饮料消费:来自秘鲁国家健康调查的证据。
Nutrients. 2022 Jan 28;14(3):582. doi: 10.3390/nu14030582.
5
Association of sugar-sweetened beverage and artificially sweetened beverage intakes with mortality: an analysis of US National Health and Nutrition Examination Survey.含糖饮料和人工甜味饮料摄入量与死亡率的关联:对美国国家健康和营养调查的分析。
Eur J Nutr. 2021 Jun;60(4):1945-1955. doi: 10.1007/s00394-020-02387-x. Epub 2020 Sep 18.
6
Using nutritional survey data to inform the design of sugar-sweetened beverage taxes in low-resource contexts: a cross-sectional analysis based on data from an adult Caribbean population.利用营养调查数据为资源匮乏环境下含糖饮料征税提供信息:基于加勒比成年人数据的横断面分析。
BMJ Open. 2020 Sep 10;10(9):e035981. doi: 10.1136/bmjopen-2019-035981.
7
Association of a Workplace Sales Ban on Sugar-Sweetened Beverages With Employee Consumption of Sugar-Sweetened Beverages and Health.工作场所禁售含糖饮料与员工含糖饮料消费和健康的关联。
JAMA Intern Med. 2020 Jan 1;180(1):9-16. doi: 10.1001/jamainternmed.2019.4434.
8
Assessing sugar-sweetened beverage intakes, added sugar intakes and BMI before and after the implementation of a sugar-sweetened beverage tax in South Africa.评估南非实施含糖饮料税后,含糖饮料摄入量、添加糖摄入量和 BMI 的变化。
Public Health Nutr. 2021 Jul;24(10):2900-2910. doi: 10.1017/S1368980020005078. Epub 2020 Dec 14.
9
Sweetened beverage intake in association to energy and sugar consumption and cardiometabolic markers in children.儿童甜味饮料摄入量与能量、糖消耗及心脏代谢指标的关系
Pediatr Obes. 2018 Apr;13(4):195-203. doi: 10.1111/ijpo.12194. Epub 2017 Jan 23.
10
Association of Sugar-Sweetened Beverages and Cardiovascular Diseases Mortality in a Large Young Cohort of Nearly 300,000 Adults (Age 20-39).含糖饮料与近 30 万成年人(20-39 岁)心血管疾病死亡率的相关性:一项大型年轻队列研究
Nutrients. 2022 Jun 29;14(13):2720. doi: 10.3390/nu14132720.

引用本文的文献

1
Fructose and glucose from sugary drinks enhance colorectal cancer metastasis via SORD.含糖饮料中的果糖和葡萄糖通过SORD促进结直肠癌转移。
Nat Metab. 2025 Sep 19. doi: 10.1038/s42255-025-01368-w.
2
Assessing changes in non-alcoholic sugary beverage prices in Agincourt following South Africa's Health Promotion Levy: A pre- and post-implementation study.南非健康促进税实施后阿金库尔非酒精含糖饮料价格变化评估:一项实施前后研究
J Public Health Res. 2025 Sep 12;14(3):22799036251358299. doi: 10.1177/22799036251358299. eCollection 2025 Jul.
3
Effect of Nudge Interventions in Real-World Kiosks on Consumer Beverage Choices to Promote Non-Sugar-Sweetened Beverage Consumption.

本文引用的文献

1
Soft Drink Intake in Europe-A Review of Data from Nationally Representative Food Consumption Surveys.欧洲软饮料摄入量-对来自全国代表性食物消费调查的数据的回顾。
Nutrients. 2023 Mar 11;15(6):1368. doi: 10.3390/nu15061368.
2
Ethics: Health Equity and Dietetics-Related Inequalities.伦理:健康公平与饮食相关不平等
J Acad Nutr Diet. 2022 Aug;122(8):1558-1562. doi: 10.1016/j.jand.2022.05.015. Epub 2022 May 23.
3
Global, regional, and national consumption of animal-source foods between 1990 and 2018: findings from the Global Dietary Database.
现实世界售货亭中的助推干预措施对消费者饮料选择以促进非含糖饮料消费的影响。
Nutrients. 2025 Jul 31;17(15):2524. doi: 10.3390/nu17152524.
4
Quantification of regional variation in ultra-processed food consumption and its sociodemographic correlates across Bangladesh, India, Pakistan, and Sri Lanka: insights from the South Asia Biobank.孟加拉国、印度、巴基斯坦和斯里兰卡超加工食品消费的区域差异及其社会人口学相关因素的量化:来自南亚生物银行的见解。
Lancet Reg Health Southeast Asia. 2025 Jul 18;39:100633. doi: 10.1016/j.lansea.2025.100633. eCollection 2025 Aug.
5
Sugar-sweetened beverages and water intake among Indigenous youth in the United States and Canada: a scoping review of interventions.美国和加拿大原住民青年的含糖饮料和水摄入量:干预措施的范围综述
Int J Circumpolar Health. 2025 Dec;84(1):2528298. doi: 10.1080/22423982.2025.2528298. Epub 2025 Jul 28.
6
Global pattern, trend, and cross-country health inequality of adult acne aged 25 + years from 1990 to 2021, a comprehensive analysis for global burden of disease and global dietary database.1990年至2021年25岁及以上成人痤疮的全球模式、趋势和跨国健康不平等:对全球疾病负担和全球饮食数据库的综合分析
J Health Popul Nutr. 2025 Jul 4;44(1):238. doi: 10.1186/s41043-025-00847-w.
7
Health effects associated with consumption of processed meat, sugar-sweetened beverages and trans fatty acids: a Burden of Proof study.与食用加工肉类、含糖饮料和反式脂肪酸相关的健康影响:一项举证责任研究。
Nat Med. 2025 Jun 30. doi: 10.1038/s41591-025-03775-8.
8
Less-sweet drink policy and campaign-Thailand's success story.低糖饮料政策与运动——泰国的成功故事。
Lancet Reg Health Southeast Asia. 2025 Jun 13;38:100620. doi: 10.1016/j.lansea.2025.100620. eCollection 2025 Jul.
9
Dietary Patterns and Sustainable Lifestyles: A Multicenter Study from Latin America and Spain.饮食模式与可持续生活方式:一项来自拉丁美洲和西班牙的多中心研究
Foods. 2025 Jun 11;14(12):2065. doi: 10.3390/foods14122065.
10
Young-onset type 2 diabetes-Epidemiology, pathophysiology, and management.青年发病型2型糖尿病——流行病学、病理生理学及管理
J Diabetes Investig. 2025 Jul;16(7):1157-1172. doi: 10.1111/jdi.70081. Epub 2025 May 24.
全球、地区和国家 1990 年至 2018 年动物源食品消费情况:来自全球饮食数据库的研究结果。
Lancet Planet Health. 2022 Mar;6(3):e243-e256. doi: 10.1016/S2542-5196(21)00352-1.
4
Evaluation of the Quality of Evidence of the Association of Foods and Nutrients With Cardiovascular Disease and Diabetes: A Systematic Review.评估食物和营养素与心血管疾病和糖尿病关联的证据质量:系统评价。
JAMA Netw Open. 2022 Feb 1;5(2):e2146705. doi: 10.1001/jamanetworkopen.2021.46705.
5
The role of sugar-sweetened beverages in the global epidemics of obesity and chronic diseases.含糖饮料在肥胖和慢性病全球流行中的作用。
Nat Rev Endocrinol. 2022 Apr;18(4):205-218. doi: 10.1038/s41574-021-00627-6. Epub 2022 Jan 21.
6
The nutrition transition to a stage of high obesity and noncommunicable disease prevalence dominated by ultra-processed foods is not inevitable.向以超高加工食品为主导、肥胖和非传染性疾病高发的营养转型阶段发展并非不可避免。
Obes Rev. 2022 Jan;23(1):e13366. doi: 10.1111/obr.13366. Epub 2021 Oct 10.
7
Food and beverage industry interference in science and policy: efforts to block soda tax implementation in Mexico and prevent international diffusion.食品和饮料行业对科学和政策的干扰:阻止墨西哥实施苏打税并防止国际扩散的努力。
BMJ Glob Health. 2021 Aug;6(8). doi: 10.1136/bmjgh-2021-005662.
8
Differences in modelled estimates of global dietary intake.全球饮食摄入量模型估计值的差异。
Lancet. 2021 May 8;397(10286):1708-1709. doi: 10.1016/S0140-6736(21)00714-5.
9
The data availability landscape in seven sub-Saharan African countries and its role in strengthening sugar-sweetened beverage taxation.七个撒哈拉以南非洲国家的数据提供情况及其在加强含糖饮料征税方面的作用。
Glob Health Action. 2021 Jan 1;14(1):1871189. doi: 10.1080/16549716.2020.1871189.
10
Sugar-sweetened beverage consumption from 1998-2017: Findings from the health behaviour in school-aged children/school health research network in Wales.1998-2017 年含糖饮料消费情况:威尔士学龄儿童健康行为/学校健康研究网络的研究结果。
PLoS One. 2021 Apr 14;16(4):e0248847. doi: 10.1371/journal.pone.0248847. eCollection 2021.