• 文献检索
  • 文档翻译
  • 深度研究
  • 学术资讯
  • Suppr Zotero 插件Zotero 插件
  • 邀请有礼
  • 套餐&价格
  • 历史记录
应用&插件
Suppr Zotero 插件Zotero 插件浏览器插件Mac 客户端Windows 客户端微信小程序
定价
高级版会员购买积分包购买API积分包
服务
文献检索文档翻译深度研究API 文档MCP 服务
关于我们
关于 Suppr公司介绍联系我们用户协议隐私条款
关注我们

Suppr 超能文献

核心技术专利:CN118964589B侵权必究
粤ICP备2023148730 号-1Suppr @ 2026

文献检索

告别复杂PubMed语法,用中文像聊天一样搜索,搜遍4000万医学文献。AI智能推荐,让科研检索更轻松。

立即免费搜索

文件翻译

保留排版,准确专业,支持PDF/Word/PPT等文件格式,支持 12+语言互译。

免费翻译文档

深度研究

AI帮你快速写综述,25分钟生成高质量综述,智能提取关键信息,辅助科研写作。

立即免费体验

产业和能源结构对中国各部门二氧化碳排放峰值轨迹的重构效应。

Restructuring effects of industrial and energy structures on sectoral CO emission peak trajectories in China.

作者信息

Yang Juan, Yu Shiwei, Sun Ya-Fang

机构信息

Center for Energy Environmental Management and Decision-making, China University of Geosciences, Wuhan 430074, China.

School of Economics and Management, China University of Geosciences, Wuhan 430074, China.

出版信息

iScience. 2024 Jul 19;27(8):110541. doi: 10.1016/j.isci.2024.110541. eCollection 2024 Aug 16.

DOI:10.1016/j.isci.2024.110541
PMID:39184435
原文链接:https://pmc.ncbi.nlm.nih.gov/articles/PMC11342204/
Abstract

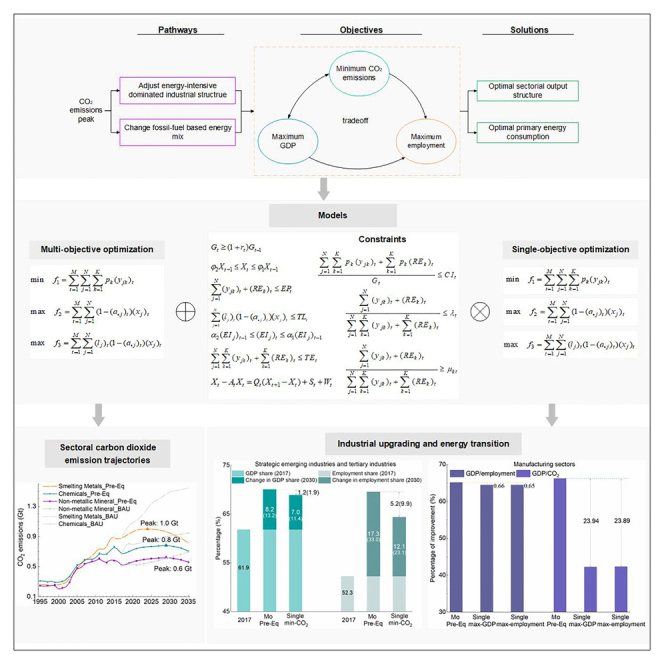
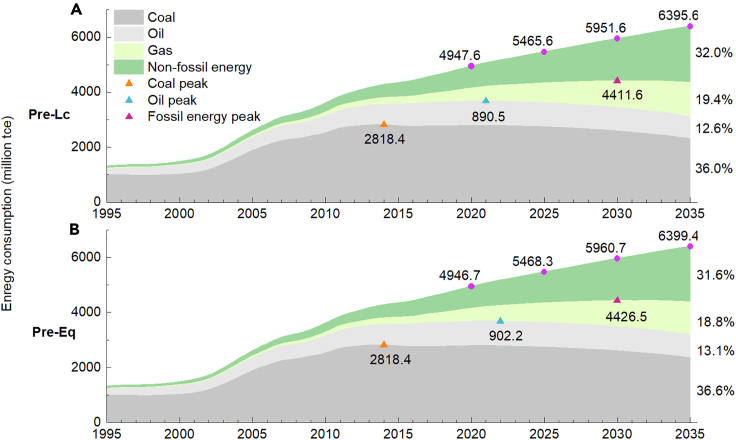
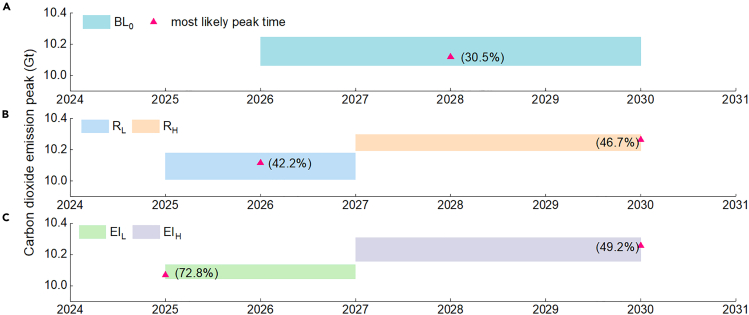
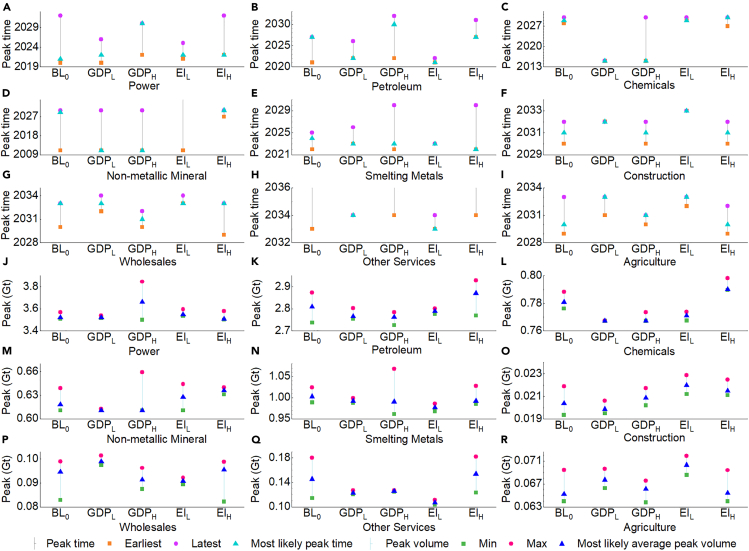
Economic sectors are pivotal in achieving China's dual carbon goals; nevertheless, the combined impact of industrial and energy consumption structures on sectors' peak pathways remains unresolved. We extend the optimization of separate industrial and energy structures to a multi-objective dynamic input-output optimization model. Findings indicate the following. (1) China's energy-related CO emissions are projected to peak in 2028, reaching a volume of 10.06-10.25 Gt. The contribution of industrial structure upgrading to this peak is three times greater than that of energy structure transformation. (2) Approximately 40% of sectors can delay their peaks until after 2030 without impeding China's overall peaking before 2030. (3) Compared with the single objective of minimizing CO emissions, China can not only achieve its carbon peak earlier but also enhance its average annual gross domestic product (GDP) growth rates by more than 0.26 percentage points and increase the non-fossil energy use's share by at least 2.78%.

摘要

经济部门在实现中国的双碳目标中起着关键作用;然而,产业和能源消费结构对各部门达峰路径的综合影响仍未得到解决。我们将单独的产业和能源结构优化扩展到一个多目标动态投入产出优化模型。研究结果表明如下:(1)预计中国与能源相关的二氧化碳排放量将在2028年达到峰值,达到10.06 - 10.25亿吨。产业结构升级对这一峰值的贡献是能源结构转型的三倍。(2)约40%的部门可以将其峰值推迟到2030年以后,而不会阻碍中国在2030年前整体达峰。(3)与将二氧化碳排放量降至最低的单一目标相比,中国不仅可以更早实现碳达峰,还可以将其年均国内生产总值(GDP)增长率提高超过0.26个百分点,并将非化石能源使用占比提高至少2.78%。

https://cdn.ncbi.nlm.nih.gov/pmc/blobs/29e8/11342204/a13d00d0de99/gr15.jpg
https://cdn.ncbi.nlm.nih.gov/pmc/blobs/29e8/11342204/aafda2fb346b/fx1.jpg
https://cdn.ncbi.nlm.nih.gov/pmc/blobs/29e8/11342204/d8158ec9c271/gr1.jpg
https://cdn.ncbi.nlm.nih.gov/pmc/blobs/29e8/11342204/0943864ae428/gr2.jpg
https://cdn.ncbi.nlm.nih.gov/pmc/blobs/29e8/11342204/47e7543371b0/gr3.jpg
https://cdn.ncbi.nlm.nih.gov/pmc/blobs/29e8/11342204/6833c44e9459/gr4.jpg
https://cdn.ncbi.nlm.nih.gov/pmc/blobs/29e8/11342204/3df25e6ed598/gr5.jpg
https://cdn.ncbi.nlm.nih.gov/pmc/blobs/29e8/11342204/609fe238b9da/gr6.jpg
https://cdn.ncbi.nlm.nih.gov/pmc/blobs/29e8/11342204/5d85eb7bdcee/gr7.jpg
https://cdn.ncbi.nlm.nih.gov/pmc/blobs/29e8/11342204/51fe3f873925/gr8.jpg
https://cdn.ncbi.nlm.nih.gov/pmc/blobs/29e8/11342204/4582af80189e/gr9.jpg
https://cdn.ncbi.nlm.nih.gov/pmc/blobs/29e8/11342204/f9400fa35925/gr10.jpg
https://cdn.ncbi.nlm.nih.gov/pmc/blobs/29e8/11342204/90bc2d84cadf/gr11.jpg
https://cdn.ncbi.nlm.nih.gov/pmc/blobs/29e8/11342204/8b7da299de2e/gr12.jpg
https://cdn.ncbi.nlm.nih.gov/pmc/blobs/29e8/11342204/60184f10df7b/gr13.jpg
https://cdn.ncbi.nlm.nih.gov/pmc/blobs/29e8/11342204/bfb4198aa5cd/gr14.jpg
https://cdn.ncbi.nlm.nih.gov/pmc/blobs/29e8/11342204/a13d00d0de99/gr15.jpg

相似文献

1
Restructuring effects of industrial and energy structures on sectoral CO emission peak trajectories in China.产业和能源结构对中国各部门二氧化碳排放峰值轨迹的重构效应。
iScience. 2024 Jul 19;27(8):110541. doi: 10.1016/j.isci.2024.110541. eCollection 2024 Aug 16.
2
Assessing the possibility of China reaching carbon emission peak by 2030 in the context of the COVID-19 pandemic.评估中国在新冠疫情背景下能否在 2030 年前实现碳达峰。
Environ Sci Pollut Res Int. 2023 Nov;30(52):111995-112018. doi: 10.1007/s11356-023-30102-w. Epub 2023 Oct 12.
3
Can China achieve its climate pledge: a multi-scenario simulation of China's energy-related CO emission pathways based on Kaya identity.中国能否实现其气候承诺:基于 Kaya 恒等式的中国能源相关 CO2 排放途径的多情景模拟。
Environ Sci Pollut Res Int. 2022 Oct;29(49):74480-74499. doi: 10.1007/s11356-022-21044-w. Epub 2022 May 31.
4
Role of economic structural change in the peaking of China's CO emissions: An input-output optimization model.经济结构变化在中国二氧化碳排放峰值中的作用:一种投入产出优化模型。
Sci Total Environ. 2021 Mar 20;761:143306. doi: 10.1016/j.scitotenv.2020.143306. Epub 2020 Nov 4.
5
How to effectively achieve air pollutant reduction and carbon mitigation in China's industrial sector? A study based on decomposition analysis and scenario simulation.如何在中国工业部门有效实现减污降碳?基于分解分析和情景模拟的研究。
Environ Sci Pollut Res Int. 2024 May;31(21):30972-30987. doi: 10.1007/s11356-024-33275-0. Epub 2024 Apr 15.
6
The Goal of Carbon Peaking, Carbon Emissions, and the Economic Effects of China's Energy Planning Policy: Analysis Using a CGE Model.碳达峰、碳排放目标与中国能源规划政策的经济效应:基于 CGE 模型的分析。
Int J Environ Res Public Health. 2022 Dec 22;20(1):165. doi: 10.3390/ijerph20010165.
7
Decoupling of the Growing Exports in Foreign Trade from the Declining Gross Exports of Embodied Energy.对外贸易中不断增长的出口与隐含能源总出口下降脱钩。
Int J Environ Res Public Health. 2022 Aug 5;19(15):9625. doi: 10.3390/ijerph19159625.
8
The 2023 Latin America report of the Countdown on health and climate change: the imperative for health-centred climate-resilient development.《2023年健康与气候变化倒计时拉丁美洲报告:以健康为中心的气候适应型发展的必要性》
Lancet Reg Health Am. 2024 Apr 23;33:100746. doi: 10.1016/j.lana.2024.100746. eCollection 2024 May.
9
Multi-scenario reduction pathways and decoupling analysis of China's sectoral carbon emissions.中国各部门碳排放的多情景减排路径与脱钩分析
iScience. 2023 Nov 8;26(12):108404. doi: 10.1016/j.isci.2023.108404. eCollection 2023 Dec 15.
10
Dynamic evolution analysis of the factors driving the growth of energy-related CO2 emissions in China: An input-output analysis.中国能源相关二氧化碳排放增长驱动因素的动态演变分析:投入产出分析。
PLoS One. 2020 Dec 16;15(12):e0243557. doi: 10.1371/journal.pone.0243557. eCollection 2020.

本文引用的文献

1
Approaching national climate targets in China considering the challenge of regional inequality.考虑到地区不平等挑战,中国如何实现国家气候目标。
Nat Commun. 2023 Dec 15;14(1):8342. doi: 10.1038/s41467-023-44122-0.
2
High-frequency sectoral carbon and environmental analysis based on monthly input-output tables compilation during 2018-2021.基于2018 - 2021年每月投入产出表编制的高频部门碳与环境分析
iScience. 2023 Sep 30;26(11):108045. doi: 10.1016/j.isci.2023.108045. eCollection 2023 Nov 17.
3
Carbon emission structure decomposition analysis of manufacturing industry from the perspective of input-output subsystem: a case study of China.
从投入产出子系统的角度对制造业碳排放结构的分解分析——以中国为例。
Environ Sci Pollut Res Int. 2023 Feb;30(7):19012-19029. doi: 10.1007/s11356-022-23334-9. Epub 2022 Oct 12.
4
Multi-factor decomposition and multi-scenario prediction decoupling analysis of China's carbon emission under dual carbon goal.双碳目标下中国碳排放的多因素分解与多情景预测解耦分析。
Sci Total Environ. 2022 Oct 1;841:156788. doi: 10.1016/j.scitotenv.2022.156788. Epub 2022 Jun 18.
5
Synergistic effect of carbon ETS and carbon tax under China's peak emission target: A dynamic CGE analysis.中国碳排放峰值目标下碳交易体系与碳税的协同效应:动态可计算一般均衡分析
Sci Total Environ. 2022 Jun 15;825:154076. doi: 10.1016/j.scitotenv.2022.154076. Epub 2022 Feb 23.
6
Decomposition and prediction of China's carbon emission intensity towards carbon neutrality: From perspectives of national, regional and sectoral level.中国实现碳中和的碳排放强度分解与预测:从国家、区域和部门层面的视角
Sci Total Environ. 2022 Jun 15;825:153839. doi: 10.1016/j.scitotenv.2022.153839. Epub 2022 Feb 15.
7
Energy structure, digital economy, and carbon emissions: evidence from China.能源结构、数字经济与碳排放:来自中国的证据。
Environ Sci Pollut Res Int. 2021 Dec;28(45):64606-64629. doi: 10.1007/s11356-021-15304-4. Epub 2021 Jul 27.
8
Role of economic structural change in the peaking of China's CO emissions: An input-output optimization model.经济结构变化在中国二氧化碳排放峰值中的作用:一种投入产出优化模型。
Sci Total Environ. 2021 Mar 20;761:143306. doi: 10.1016/j.scitotenv.2020.143306. Epub 2020 Nov 4.
9
Evolutionary path and driving forces of inter-industry transfer of CO emissions in China: Evidence from structural path and decomposition analysis.中国碳排放行业间转移的演进路径及驱动力:基于结构路径与分解分析的证据。
Sci Total Environ. 2021 Apr 15;765:142773. doi: 10.1016/j.scitotenv.2020.142773. Epub 2020 Oct 7.
10
Analysis on the carbon emission peaks of China's industrial, building, transport, and agricultural sectors.分析中国工业、建筑、交通和农业部门的碳排放峰值。
Sci Total Environ. 2020 Mar 20;709:135768. doi: 10.1016/j.scitotenv.2019.135768. Epub 2019 Nov 27.