Lancet Reg Health Am. 2025 Apr 17;45:101064. doi: 10.1016/j.lana.2025.101064. eCollection 2025 May.
There are substantial disparities in longevity in the USA; however, differences in healthy life expectancy (HALE) remain incompletely understood. We aimed to examine trends and disparities in HALE by race and ethnicity for 3 110 US counties.
We used data from the American Community Survey (2009-19, N = 23.9 m-30.5 m, across indicators), Behavioral Risk Factor Surveillance System (2011-19, N = 1.7 m-3.9 m), Gallup Daily Survey (2009-16, N = 1.8 m-1.9 m); sociodemographic covariates; and disease-specific mortality rates in small-area estimation models to estimate Years Lived with Disability (YLDs) by county, race and ethnicity (American Indian or Alaska Native [AIAN], Asian or Pacific Islander [Asian], Black, Latino or Hispanic [Latino], and White), sex, age, and year (2009-19). We derived HALE using these YLD rates to discount life expectancy.
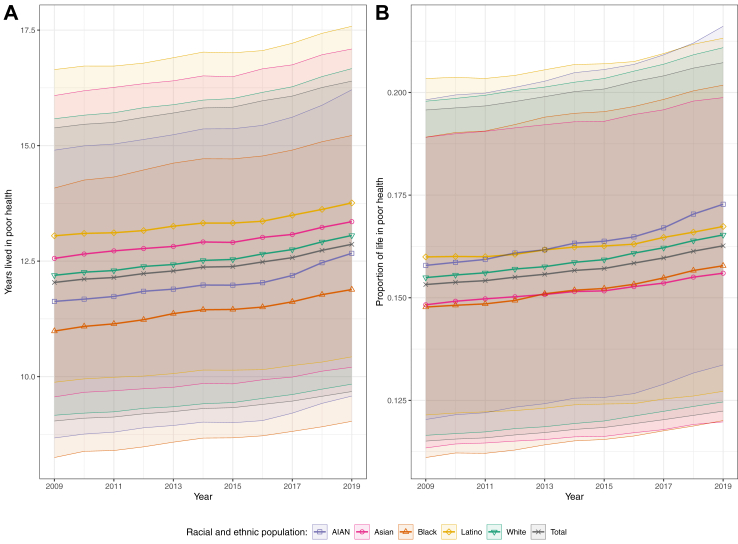
From 2009 to 2019, HALE declined nationally by 0.3 years (95% uncertainty interval: 0.1-0.5) to 66.2 (62.7-69.4), while life expectancy increased by 0.5 years (0.5-0.5) to 79.1 (79.1-79.1). The Asian population had the highest HALE (72.3 [68.5-75.5] in 2019), followed by the Latino (68.5 [64.7-71.8]), White (65.9 [62.3-69.1]), Black (63.4 [60.1-66.3]), and AIAN populations (60.7 [57.0-64.1]). The Latino population had the longest absolute duration in poor health (13.8 years [10.4-17.6] in 2019) whereas the AIAN population had the longest proportion of life in poor health (17.3% [13.0-22.2]). From 2009 to 2019, HALE declined for the AIAN (by 1.4 years [1.0-1.8]) and White (by 0.6 years [0.4-0.8]) populations and the proportion of life in poor health increased for all populations. At the county level, HALE declined in 91.3% of counties (2 812 of 3 079; 65.6% statistically significant) from 2000 to 2019 and ranged from 55.1 to 76.2 years in 2019. Racial and ethnic disparities at the county level were broadly similar to national patterns, but with some exceptions.
Disparities in HALE in the USA are large, and HALE has worsened for many populations in recent years. The expanding duration and proportion of life spent in poor health could indicate an increasing need for health services.
Intramural Research Program, National Institute on Minority Health and Health Disparities, US National Institutes of Health (contract #75N94023C00004). Intramural Research Program, National Institute on Minority Health and Health Disparities; National Heart, Lung, and Blood Institute; Intramural Research Program, National Cancer Institute; National Institute on Aging; National Institute of Arthritis and Musculoskeletal and Skin Diseases; Office of Disease Prevention; and Office of Behavioral and Social Sciences Research, US National Institutes of Health (contract #75N94019C00016).

美国在寿命方面存在显著差异;然而,人们对健康预期寿命(HALE)的差异仍未完全理解。我们旨在研究美国3110个县按种族和族裔划分的HALE趋势及差异。
我们使用了美国社区调查(2009 - 2019年,各指标下N = 2390万 - 3050万)、行为风险因素监测系统(2011 - 2019年,N = 170万 - 390万)、盖洛普每日调查(2009 - 2016年,N = 180万 - 190万)的数据;社会人口统计学协变量;以及小区域估计模型中的特定疾病死亡率,以按县、种族和族裔(美国印第安人或阿拉斯加原住民[AIAN]、亚裔或太平洋岛民[亚裔]、黑人、拉丁裔或西班牙裔[拉丁裔]以及白人)、性别、年龄和年份(2009 - 2019年)估计残疾生存年数(YLDs)。我们使用这些YLD率来折算预期寿命,从而得出HALE。
从2009年到2019年,全国HALE下降了0.3年(95%不确定区间:0.1 - 0.5)至66.2(62.7 - 69.4),而预期寿命增加了0.5年(0.5 - 0.5)至79.1(79.1 - 79.1)。亚裔人口的HALE最高(2019年为72.3[68.5 - 75.5]),其次是拉丁裔(68.5[64.7 - 71.8])、白人(65.9[62.3 - 69.1])、黑人(63.4[60.1 - 66.3])和AIAN人口(60.7[57.0 - 64.1])。拉丁裔人口健康状况不佳的绝对时长最长(2019年为13.8年[10.4 - 17.6]),而AIAN人口健康状况不佳的生命占比最长(17.3%[13.0 - 22.2])。从2009年到2019年,AIAN人口(下降1.4年[1.0 - 1.8])和白人人口(下降0.6年[0.4 - 0.8])的HALE下降,且所有人口健康状况不佳的生命占比均有所增加。在县一级,从2000年到2019年,91.3%的县(3079个县中的2812个;65.6%具有统计学意义)HALE下降,2019年HALE范围为55.1至76.2年。县一级的种族和族裔差异与全国模式大致相似,但存在一些例外。
美国HALE的差异很大,近年来许多人群的HALE有所恶化。健康状况不佳的生命时长和占比不断增加,这可能表明对医疗服务的需求日益增长。
美国国立卫生研究院少数族裔健康与健康差异研究所内部研究项目(合同编号#75N94023C00004)。美国国立卫生研究院少数族裔健康与健康差异研究所内部研究项目;国家心肺血液研究所;国家癌症研究所内部研究项目;国家老龄问题研究所;国家关节炎、肌肉骨骼和皮肤疾病研究所;疾病预防办公室;以及行为和社会科学研究办公室(合同编号#75N94019C00016)。