Department of Human Nutrition, University of Warmia and Mazury, Słoneczna 44a, Olsztyn 10-718, Poland.
Nutrients. 2013 Jul 19;5(7):2747-76. doi: 10.3390/nu5072747.
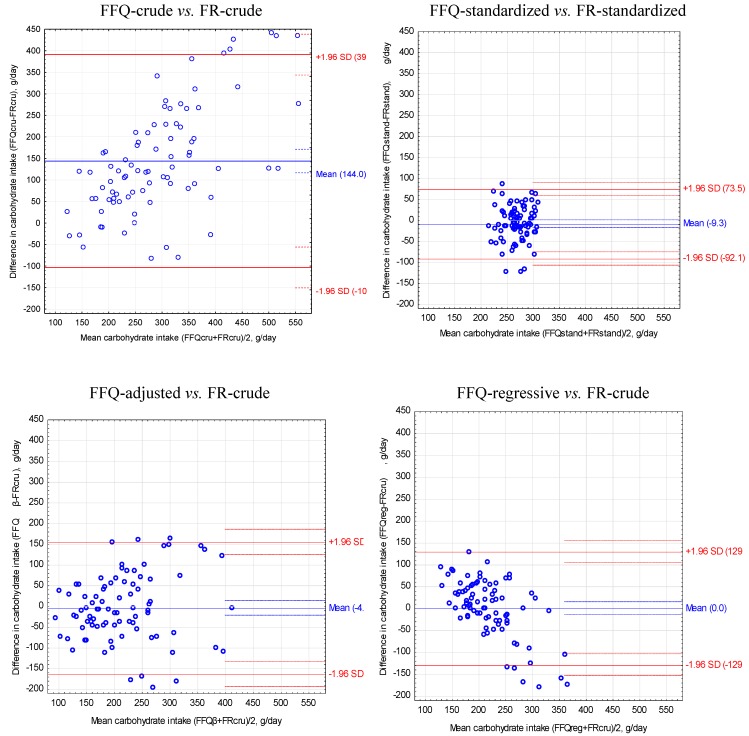
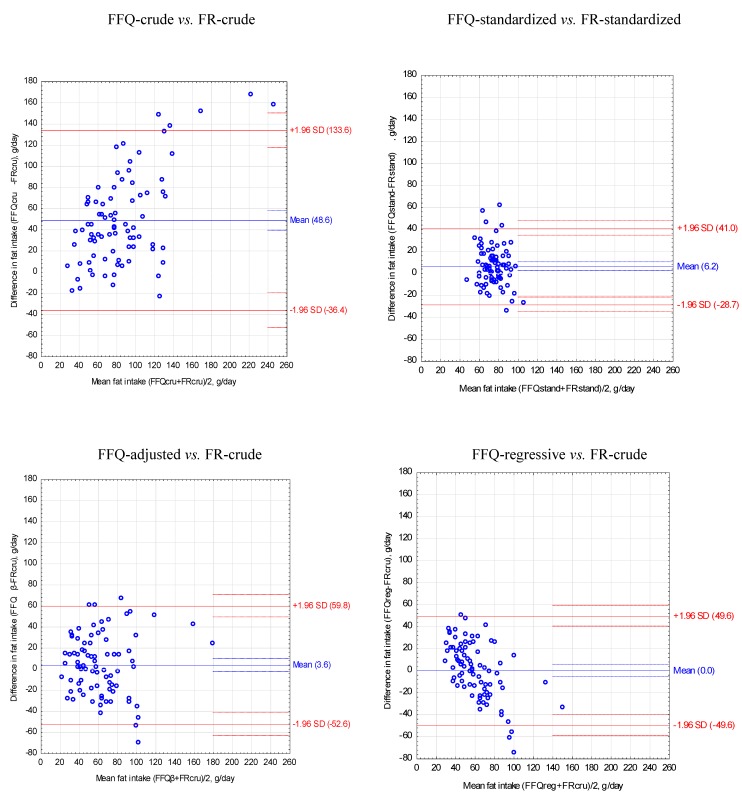
The food frequency questionnaire (FFQ) and the food record (FR) are among the most common methods used in dietary research. It is important to know that is it possible to use both methods simultaneously in dietary assessment and prepare a single, comprehensive interpretation. The aim of this study was to compare the energy and nutritional value of diets, determined by the FFQ and by the three-day food records of young women. The study involved 84 female students aged 21-26 years (mean of 22.2 ± 0.8 years). Completing the FFQ was preceded by obtaining unweighted food records covering three consecutive days. Energy and nutritional value of diets was assessed for both methods (FFQ-crude, FR-crude). Data obtained for FFQ-crude were adjusted with beta-coefficient equaling 0.5915 (FFQ-adjusted) and regression analysis (FFQ-regressive). The FFQ-adjusted was calculated as FR-crude/FFQ-crude ratio of mean daily energy intake. FFQ-regressive was calculated for energy and each nutrient separately using regression equation, including FFQ-crude and FR-crude as covariates. For FR-crude and FFQ-crude the energy value of diets was standardized to 2000 kcal (FR-standardized, FFQ-standardized). Methods of statistical comparison included a dependent samples t-test, a chi-square test, and the Bland-Altman method. The mean energy intake in FFQ-crude was significantly higher than FR-crude (2740.5 kcal vs. 1621.0 kcal, respectively). For FR-standardized and FFQ-standardized, significance differences were found in the mean intake of 18 out of 31 nutrients, for FR-crude and FFQ-adjusted in 13 out of 31 nutrients and FR-crude and FFQ-regressive in 11 out of 31 nutrients. The Bland-Altman method showed an overestimation of energy and nutrient intake by FFQ-crude in comparison to FR-crude, e.g., total protein was overestimated by 34.7 g/day (95% Confidence Interval, CI: -29.6, 99.0 g/day) and fat by 48.6 g/day (95% CI: -36.4, 133.6 g/day). After regressive transformation of FFQ, the absolute difference between FFQ-regressive and FR-crude equaled 0.0 g/day and 95% CI were much better (e.g., for total protein 95% CI: -32.7, 32.7 g/day, for fat 95% CI: -49.6, 49.6 g/day). In conclusion, differences in nutritional value of diets resulted from overestimating energy intake by the FFQ in comparison to the three-day unweighted food records. Adjustment of energy and nutrient intake applied for the FFQ using various methods, particularly regression equations, significantly improved the agreement between results obtained by both methods and dietary assessment. To obtain the most accurate results in future studies using this FFQ, energy and nutrient intake should be adjusted by the regression equations presented in this paper.
食物频率问卷 (FFQ) 和食物记录 (FR) 是膳食研究中最常用的方法。重要的是要知道,在膳食评估中同时使用这两种方法并编制一份单一的综合解释是有可能的。本研究旨在比较通过 FFQ 和年轻女性的三天食物记录确定的饮食的能量和营养值。研究对象为 84 名年龄在 21-26 岁的女性学生(平均年龄 22.2 ± 0.8 岁)。在获得连续三天的未加权食物记录之前,先完成 FFQ。使用两种方法(FFQ-粗值、FR-粗值)评估饮食的能量和营养值。FFQ-粗值的数据用等于 0.5915 的β系数进行调整(FFQ-调整)和回归分析(FFQ-回归)。FFQ-调整值是通过 FR-粗值/FFQ-粗值的平均每日能量摄入比计算得出的。使用回归方程分别为能量和每种营养素计算 FFQ-回归,其中包括 FFQ-粗值和 FR-粗值作为协变量。对于 FR-粗值和 FFQ-粗值,将饮食的能量值标准化为 2000 千卡(FR-标准化,FFQ-标准化)。统计比较方法包括配对样本 t 检验、卡方检验和 Bland-Altman 方法。FFQ-粗值的平均能量摄入量明显高于 FR-粗值(分别为 2740.5 千卡和 1621.0 千卡)。对于 FR-标准化和 FFQ-标准化,在 31 种营养素中的 18 种营养素中发现了摄入量的显著差异,对于 FR-粗值和 FFQ-调整,在 31 种营养素中的 13 种营养素中发现了差异,对于 FR-粗值和 FFQ-回归,在 31 种营养素中的 11 种营养素中发现了差异。Bland-Altman 方法显示,与 FR-粗值相比,FFQ-粗值高估了能量和营养素的摄入量,例如,总蛋白高估了 34.7 克/天(95%置信区间,CI:-29.6,99.0 克/天),脂肪高估了 48.6 克/天(95% CI:-36.4,133.6 克/天)。在 FFQ 回归转换后,FFQ-回归和 FR-粗值之间的绝对差异为 0.0 克/天,95%CI 要好得多(例如,总蛋白 95%CI:-32.7,32.7 克/天,脂肪 95%CI:-49.6,49.6 克/天)。总之,与三天未加权食物记录相比,FFQ 高估了能量摄入,导致饮食的营养值存在差异。使用各种方法(特别是回归方程)对 FFQ 的能量和营养素摄入量进行调整,显著提高了两种方法之间的结果一致性和膳食评估。为了在未来使用该 FFQ 的研究中获得最准确的结果,应使用本文提出的回归方程对能量和营养素摄入量进行调整。