Biomedical Image Technologies, ETSIT, Universidad Politécnica de Madrid, CEIMoncloa, Madrid, Spain; Research Center in Bioengineering, Biomaterials and Nanomedicine (CIBER-BBN), Madrid, Spain; Madrid-MIT M+Visión Consortium, Massachusetts Institute of Technology, Cambridge, Massachusetts, United States of America.
Biomedical Image Technologies, ETSIT, Universidad Politécnica de Madrid, CEIMoncloa, Madrid, Spain; Research Center in Bioengineering, Biomaterials and Nanomedicine (CIBER-BBN), Madrid, Spain.
PLoS Comput Biol. 2014 Jun 19;10(6):e1003670. doi: 10.1371/journal.pcbi.1003670. eCollection 2014 Jun.
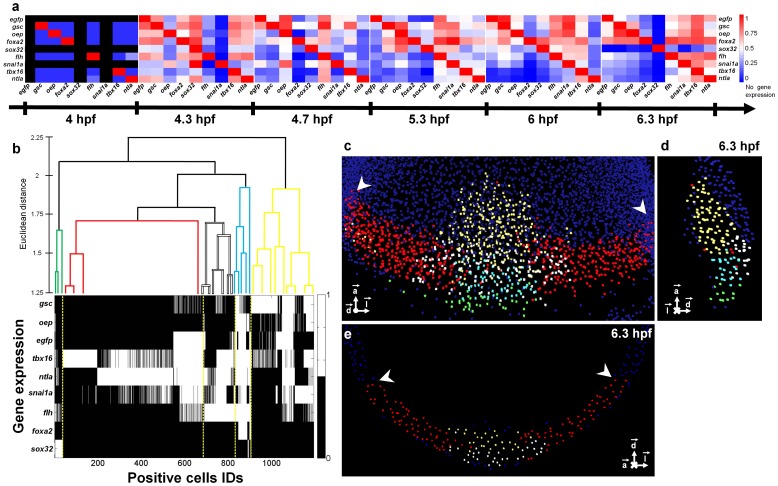
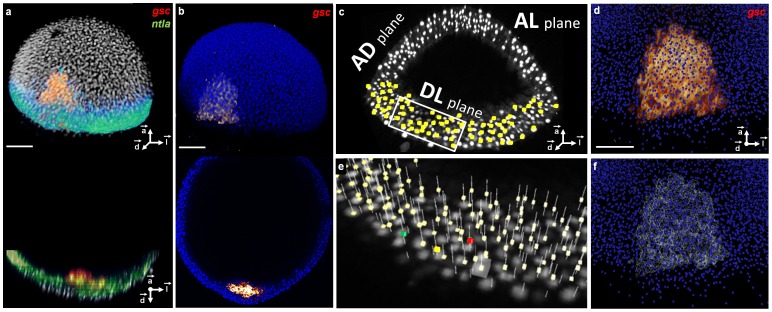
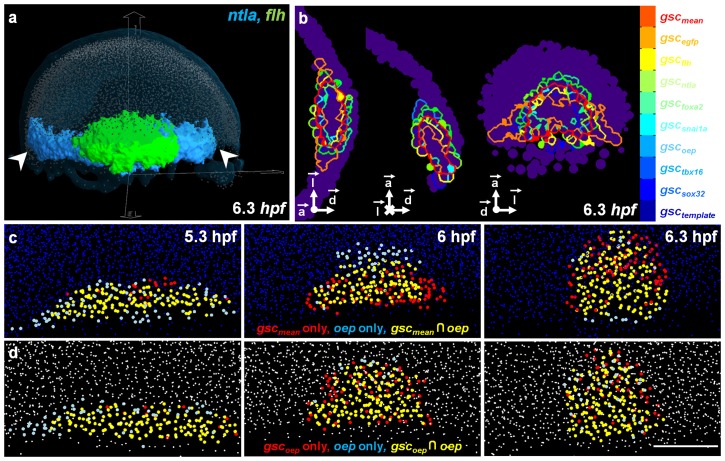
A gene expression atlas is an essential resource to quantify and understand the multiscale processes of embryogenesis in time and space. The automated reconstruction of a prototypic 4D atlas for vertebrate early embryos, using multicolor fluorescence in situ hybridization with nuclear counterstain, requires dedicated computational strategies. To this goal, we designed an original methodological framework implemented in a software tool called Match-IT. With only minimal human supervision, our system is able to gather gene expression patterns observed in different analyzed embryos with phenotypic variability and map them onto a series of common 3D templates over time, creating a 4D atlas. This framework was used to construct an atlas composed of 6 gene expression templates from a cohort of zebrafish early embryos spanning 6 developmental stages from 4 to 6.3 hpf (hours post fertilization). They included 53 specimens, 181,415 detected cell nuclei and the segmentation of 98 gene expression patterns observed in 3D for 9 different genes. In addition, an interactive visualization software, Atlas-IT, was developed to inspect, supervise and analyze the atlas. Match-IT and Atlas-IT, including user manuals, representative datasets and video tutorials, are publicly and freely available online. We also propose computational methods and tools for the quantitative assessment of the gene expression templates at the cellular scale, with the identification, visualization and analysis of coexpression patterns, synexpression groups and their dynamics through developmental stages.
基因表达图谱是定量和理解胚胎发生在时间和空间上的多尺度过程的重要资源。使用核染色的多色荧光原位杂交,自动重建脊椎动物早期胚胎的典型 4D 图谱,需要专门的计算策略。为此,我们设计了一种原始的方法框架,该框架在称为 Match-IT 的软件工具中实现。我们的系统只需进行最小限度的人工监督,就能够从具有表型可变性的不同分析胚胎中收集基因表达模式,并将其映射到随时间推移的一系列通用 3D 模板上,从而创建 4D 图谱。该框架用于构建一个由 6 个基因表达模板组成的图谱,这些模板来自一个跨越从受精后 4 小时到 6.3 小时的 6 个发育阶段的斑马鱼早期胚胎队列。它们包括 53 个样本、181415 个检测到的细胞核以及在 3D 中观察到的 9 个不同基因的 98 个基因表达模式的分割。此外,还开发了一个交互式可视化软件 Atlas-IT,用于检查、监督和分析图谱。Match-IT 和 Atlas-IT,包括用户手册、代表性数据集和视频教程,都可以在线公开和免费使用。我们还提出了用于在细胞尺度上对基因表达模板进行定量评估的计算方法和工具,通过发育阶段识别、可视化和分析共表达模式、同步表达组及其动态。