• 文献检索
  • 文档翻译
  • 深度研究
  • 学术资讯
  • Suppr Zotero 插件Zotero 插件
  • 邀请有礼
  • 套餐&价格
  • 历史记录
应用&插件
Suppr Zotero 插件Zotero 插件浏览器插件Mac 客户端Windows 客户端微信小程序
定价
高级版会员购买积分包购买API积分包
服务
文献检索文档翻译深度研究API 文档MCP 服务
关于我们
关于 Suppr公司介绍联系我们用户协议隐私条款
关注我们

Suppr 超能文献

核心技术专利:CN118964589B侵权必究
粤ICP备2023148730 号-1Suppr @ 2026

文献检索

告别复杂PubMed语法,用中文像聊天一样搜索,搜遍4000万医学文献。AI智能推荐,让科研检索更轻松。

立即免费搜索

文件翻译

保留排版,准确专业,支持PDF/Word/PPT等文件格式,支持 12+语言互译。

免费翻译文档

深度研究

AI帮你快速写综述,25分钟生成高质量综述,智能提取关键信息,辅助科研写作。

立即免费体验

2004年至2011年中国各省流感发病率的时间序列分析

Time series analysis of influenza incidence in Chinese provinces from 2004 to 2011.

作者信息

Song Xin, Xiao Jun, Deng Jiang, Kang Qiong, Zhang Yanyu, Xu Jinbo

机构信息

Beijing Key Laboratory of Blood Safety and Supply Technologies, Beijing Institute of Transfusion Medicine, Haidian District, Beijing.

出版信息

Medicine (Baltimore). 2016 Jun;95(26):e3929. doi: 10.1097/MD.0000000000003929.

DOI:10.1097/MD.0000000000003929
PMID:27367989
原文链接:https://pmc.ncbi.nlm.nih.gov/articles/PMC4937903/
Abstract

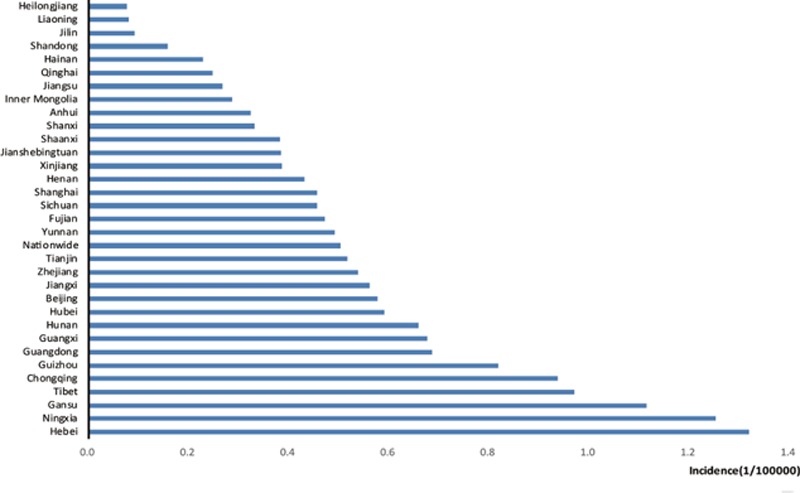
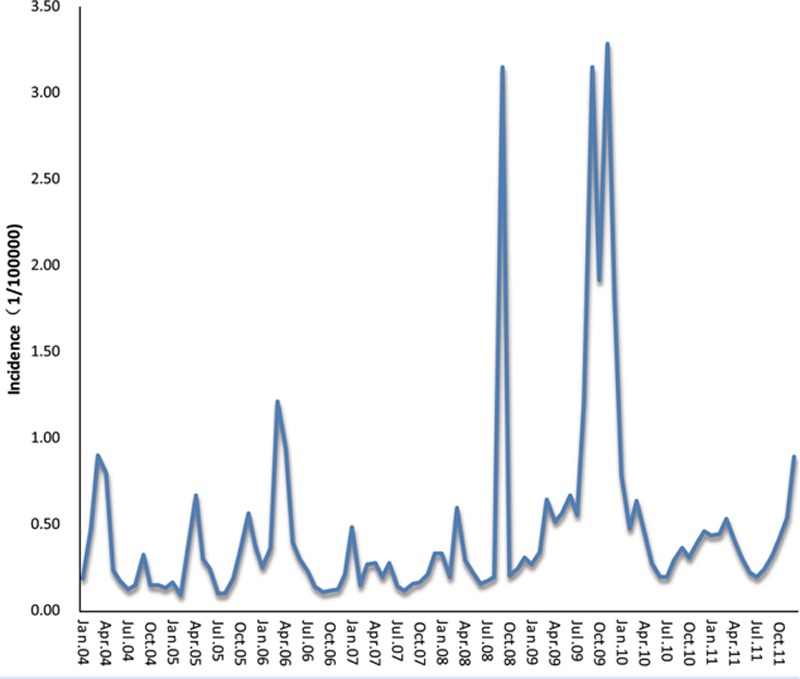
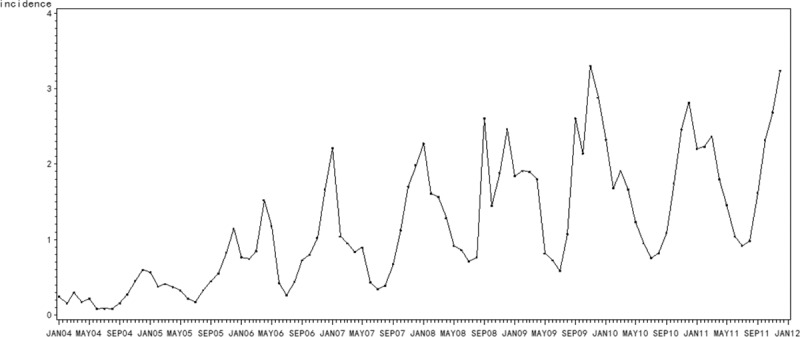
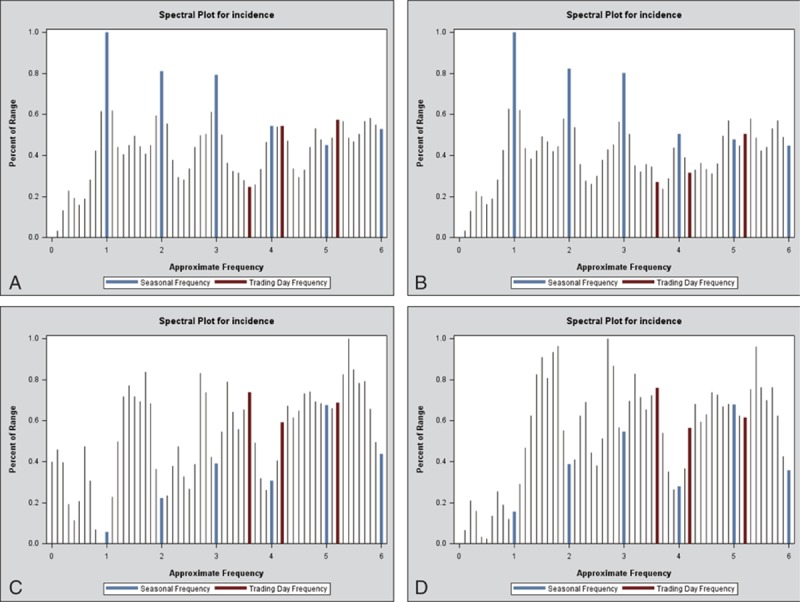
Influenza as a severe infectious disease has caused catastrophes throughout human history, and every pandemic of influenza has produced a great social burden. We compiled monthly data of influenza incidence from all provinces and autonomous regions in mainland China from January 2004 to December 2011, comprehensively evaluated and classified these data, and then randomly selected 4 provinces with higher incidence (Hebei, Gansu, Guizhou, and Hunan), 2 provinces with median incidence (Tianjin and Henan), 1 province with lower incidence (Shandong), using time series analysis to construct an ARIMA model, which is based on the monthly incidence from 2004 to 2011 as the training set. We exerted the X-12-ARIMA procedure for modeling due to the seasonality these data implied. Autocorrelation function (ACF), partial autocorrelation function (PACF), and automatic model selection were to determine the order of the model parameters. The optimal model was decided by a nonseasonal and seasonal moving average test. Finally, we applied this model to predict the monthly incidence of influenza in 2012 as the test set, and the simulated incidence was compared with the observed incidence to evaluate the model's validity by the criterion of both percentage variability in regression analyses (R) and root mean square error (RMSE). It is conceivable that SARIMA (0,1,1)(0,1,1)12 could simultaneously forecast the influenza incidence of the Hebei Province, Guizhou Province, Henan Province, and Shandong Province; SARIMA (1,0,0)(0,1,1)12 could forecast the influenza incidence in Gansu Province; SARIMA (3,1,1)(0,1,1)12 could forecast the influenza incidence in Tianjin City; and SARIMA (0,1,1)(0,0,1)12 could forecast the influenza incidence in Hunan Province. Time series analysis is a good tool for prediction of disease incidence.

摘要

流感作为一种严重的传染病,在人类历史上曾引发诸多灾难,每一次流感大流行都带来了巨大的社会负担。我们收集了2004年1月至2011年12月中国大陆所有省份和自治区的流感发病率月度数据,对这些数据进行了全面评估和分类,然后随机选取发病率较高的4个省份(河北、甘肃、贵州和湖南)、发病率处于中位数的2个省份(天津和河南)、发病率较低的1个省份(山东),以2004年至2011年的月度发病率作为训练集,采用时间序列分析构建ARIMA模型。由于这些数据存在季节性,我们运用X - 12 - ARIMA程序进行建模。通过自相关函数(ACF)、偏自相关函数(PACF)以及自动模型选择来确定模型参数的阶数。通过非季节性和季节性移动平均检验来确定最优模型。最后,我们将该模型应用于预测2012年的流感月度发病率作为测试集,并将模拟发病率与观察到的发病率进行比较,依据回归分析中的百分比变异(R)和均方根误差(RMSE)标准来评估模型的有效性。可以想象,SARIMA(0,1,1)(0,1,1)12能够同时预测河北省、贵州省、河南省和山东省的流感发病率;SARIMA(1,0,0)(0,1,1)12能够预测甘肃省的流感发病率;SARIMA(3,1,1)(0,1,1)12能够预测天津市的流感发病率;SARIMA(0,1,1)(0,0,1)12能够预测湖南省的流感发病率。时间序列分析是预测疾病发病率的一个良好工具。

https://cdn.ncbi.nlm.nih.gov/pmc/blobs/ae42/4937903/ae0e29a87983/medi-95-e3929-g012.jpg
https://cdn.ncbi.nlm.nih.gov/pmc/blobs/ae42/4937903/15905bd72374/medi-95-e3929-g005.jpg
https://cdn.ncbi.nlm.nih.gov/pmc/blobs/ae42/4937903/9975314f5cda/medi-95-e3929-g006.jpg
https://cdn.ncbi.nlm.nih.gov/pmc/blobs/ae42/4937903/4d67e745c252/medi-95-e3929-g007.jpg
https://cdn.ncbi.nlm.nih.gov/pmc/blobs/ae42/4937903/f01bba3775c2/medi-95-e3929-g008.jpg
https://cdn.ncbi.nlm.nih.gov/pmc/blobs/ae42/4937903/5fbe56ef650b/medi-95-e3929-g010.jpg
https://cdn.ncbi.nlm.nih.gov/pmc/blobs/ae42/4937903/3c25a58fda8b/medi-95-e3929-g011.jpg
https://cdn.ncbi.nlm.nih.gov/pmc/blobs/ae42/4937903/ae0e29a87983/medi-95-e3929-g012.jpg

相似文献

1
Time series analysis of influenza incidence in Chinese provinces from 2004 to 2011.2004年至2011年中国各省流感发病率的时间序列分析
Medicine (Baltimore). 2016 Jun;95(26):e3929. doi: 10.1097/MD.0000000000003929.
2
Predicting Seasonal Influenza Based on SARIMA Model, in Mainland China from 2005 to 2018.基于 SARIMA 模型预测 2005 年至 2018 年中国大陆的季节性流感。
Int J Environ Res Public Health. 2019 Nov 27;16(23):4760. doi: 10.3390/ijerph16234760.
3
Forecasting and analyzing influenza activity in Hebei Province, China, using a CNN-LSTM hybrid model.利用 CNN-LSTM 混合模型预测和分析中国河北省的流感活动。
BMC Public Health. 2024 Aug 12;24(1):2171. doi: 10.1186/s12889-024-19590-8.
4
A new hybrid model SARIMA-ETS-SVR for seasonal influenza incidence prediction in mainland China.一种用于中国大陆季节性流感发病率预测的新型SARIMA-ETS-SVR混合模型。
J Infect Dev Ctries. 2023 Nov 30;17(11):1581-1590. doi: 10.3855/jidc.18037.
5
Study on the prediction effect of a combined model of SARIMA and LSTM based on SSA for influenza in Shanxi Province, China.基于 SSA 的 SARIMA 和 LSTM 组合模型对中国山西省流感的预测效果研究。
BMC Infect Dis. 2023 Feb 6;23(1):71. doi: 10.1186/s12879-023-08025-1.
6
Forecasting seasonal influenza activity in Canada-Comparing seasonal Auto-Regressive integrated moving average and artificial neural network approaches for public health preparedness.加拿大季节性流感活动预测——为公共卫生准备比较季节性自回归综合移动平均和人工神经网络方法。
Zoonoses Public Health. 2024 May;71(3):304-313. doi: 10.1111/zph.13114. Epub 2024 Feb 8.
7
Predicting the incidence of rifampicin resistant tuberculosis in Yunnan, China: a seasonal time series analysis based on routine surveillance data.预测中国云南利福平耐药结核病的发病率:基于常规监测数据的季节性时间序列分析。
BMC Infect Dis. 2024 Aug 16;24(1):835. doi: 10.1186/s12879-024-09740-z.
8
Forecasting mortality of road traffic injuries in China using seasonal autoregressive integrated moving average model.运用季节自回归求和移动平均模型预测中国道路交通事故死亡率。
Ann Epidemiol. 2015 Feb;25(2):101-6. doi: 10.1016/j.annepidem.2014.10.015. Epub 2014 Oct 31.
9
Spatiotemporal characteristics and the epidemiology of tuberculosis in China from 2004 to 2017 by the nationwide surveillance system.2004 年至 2017 年中国全国监测系统的结核病时空特征及流行病学。
BMC Public Health. 2020 Aug 26;20(1):1284. doi: 10.1186/s12889-020-09331-y.
10
Time-series analysis on human brucellosis during 2004-2013 in Shandong Province, China.2004 - 2013年中国山东省人间布鲁氏菌病的时间序列分析
Zoonoses Public Health. 2015 May;62(3):228-35. doi: 10.1111/zph.12145. Epub 2014 Jul 16.

引用本文的文献

1
Respiratory viral infections: when and where? A scoping review of spatiotemporal methods.呼吸道病毒感染:何时何地发生?时空方法的范围综述
J Glob Health. 2025 Aug 4;15:04213. doi: 10.7189/jogh.15.04213.
2
Forecasting and analyzing influenza activity in Hebei Province, China, using a CNN-LSTM hybrid model.利用 CNN-LSTM 混合模型预测和分析中国河北省的流感活动。
BMC Public Health. 2024 Aug 12;24(1):2171. doi: 10.1186/s12889-024-19590-8.
3
Trends of hospitalisation among new admission inpatients with oesophagogastric variceal bleeding in cirrhosis from 2014 to 2019 in the Affiliated Hospital of Southwest Medical University: a single-centre time-series analysis.

本文引用的文献

1
Characterizing the epidemiology, virology, and clinical features of influenza in China's first severe acute respiratory infection sentinel surveillance system, February 2011-October 2013.2011年2月至2013年10月中国首个严重急性呼吸道感染哨点监测系统中流感的流行病学、病毒学及临床特征分析
BMC Infect Dis. 2015 Mar 22;15:143. doi: 10.1186/s12879-015-0884-1.
2
The threat of human influenza: the viruses, disease impacts, and vaccine solutions.人类流感的威胁:病毒、疾病影响及疫苗解决方案
Infect Disord Drug Targets. 2014;14(3):150-4. doi: 10.2174/1871526514666141014150907.
3
An estimate of the incidence of influenza-like illness during the influenza pandemic of 2009.
2014 年至 2019 年西南医科大学附属医院肝硬化食管胃静脉曲张出血新入院患者住院趋势:单中心时间序列分析。
BMJ Open. 2024 Feb 29;14(2):e074608. doi: 10.1136/bmjopen-2023-074608.
4
Predicting the incidence of infectious diarrhea with symptom surveillance data using a stacking-based ensembled model.基于堆叠集成模型的症状监测数据预测感染性腹泻发病率。
BMC Infect Dis. 2024 Feb 26;24(1):265. doi: 10.1186/s12879-024-09138-x.
5
"Back to the future" projections for COVID-19 surges.对 COVID-19 疫情反弹的“回到未来”预测。
PLoS One. 2024 Jan 30;19(1):e0296964. doi: 10.1371/journal.pone.0296964. eCollection 2024.
6
Comparison of SARIMA model, Holt-winters model and ETS model in predicting the incidence of foodborne disease.SARIMA 模型、Holt-winters 模型和 ETS 模型在预测食源性疾病发病率中的比较。
BMC Infect Dis. 2023 Nov 16;23(1):803. doi: 10.1186/s12879-023-08799-4.
7
Impact of the program life in traffic and new zero-tolerance drinking and driving law on the prevalence of driving after alcohol abuse in Brazilian capitals: An interrupted time series analysis.项目对交通生活的影响以及新的零容忍酒后驾车法对巴西首都酒后驾车滥用流行率的影响:一项中断时间序列分析。
PLoS One. 2023 Oct 20;18(10):e0288288. doi: 10.1371/journal.pone.0288288. eCollection 2023.
8
Interrupted time series analysis using the ARIMA model of the impact of COVID-19 on the incidence rate of notifiable communicable diseases in China.利用 ARIMA 模型的中断时间序列分析 COVID-19 对中国法定传染病发病率的影响。
BMC Infect Dis. 2023 Jun 5;23(1):375. doi: 10.1186/s12879-023-08229-5.
9
Epidemiological trend in scarlet fever incidence in China during the COVID-19 pandemic: A time series analysis.中国新冠大流行期间猩红热发病率的流行病学趋势:时间序列分析。
Front Public Health. 2022 Dec 15;10:923318. doi: 10.3389/fpubh.2022.923318. eCollection 2022.
10
Application Effect of Transparent Supervision Based on Informatization in Prevention and Control of Carbapenem-Resistant Nosocomial Infection.基于信息化的透明化监管在耐碳青霉烯类医院感染防控中的应用效果
Can J Infect Dis Med Microbiol. 2022 Oct 25;2022:2193430. doi: 10.1155/2022/2193430. eCollection 2022.
2009 年流感大流行期间流感样疾病发病率的估计。
Arch Bronconeumol. 2015 Aug;51(8):373-8. doi: 10.1016/j.arbres.2014.07.009. Epub 2014 Oct 5.
4
Comparison of ARIMA and Random Forest time series models for prediction of avian influenza H5N1 outbreaks.ARIMA 和随机森林时间序列模型在预测 H5N1 禽流感暴发中的比较。
BMC Bioinformatics. 2014 Aug 13;15(1):276. doi: 10.1186/1471-2105-15-276.
5
Time series modelling and forecasting of emergency department overcrowding.急诊科拥挤的时间序列建模与预测
J Med Syst. 2014 Sep;38(9):107. doi: 10.1007/s10916-014-0107-0. Epub 2014 Jul 23.
6
Time-series analysis on human brucellosis during 2004-2013 in Shandong Province, China.2004 - 2013年中国山东省人间布鲁氏菌病的时间序列分析
Zoonoses Public Health. 2015 May;62(3):228-35. doi: 10.1111/zph.12145. Epub 2014 Jul 16.
7
Time series analysis of the impact of tobacco control policies on smoking prevalence among Australian adults, 2001-2011.2001 - 2011年澳大利亚成年人烟草控制政策对吸烟率影响的时间序列分析
Bull World Health Organ. 2014 Jun 1;92(6):413-22. doi: 10.2471/BLT.13.118448. Epub 2014 Mar 18.
8
Frequency and tendency of malaria in Colombia, 1990 to 2011: a descriptive study.1990年至2011年哥伦比亚疟疾的发病频率和趋势:一项描述性研究。
Malar J. 2014 May 29;13:202. doi: 10.1186/1475-2875-13-202.
9
Forecasting the number of human immunodeficiency virus infections in the korean population using the autoregressive integrated moving average model.使用自回归积分移动平均模型预测韩国人群中的人类免疫缺陷病毒感染数量。
Osong Public Health Res Perspect. 2013 Dec;4(6):358-62. doi: 10.1016/j.phrp.2013.10.009. Epub 2013 Dec 3.
10
Spatio-temporal trends and risk factors for Shigella from 2001 to 2011 in Jiangsu Province, People's Republic of China.2001年至2011年中华人民共和国江苏省志贺氏菌的时空趋势及风险因素
PLoS One. 2014 Jan 8;9(1):e83487. doi: 10.1371/journal.pone.0083487. eCollection 2014.