RAND Corporation, Santa Monica, CA, USA.
Heinz College, Carnegie Mellon University, Pittsburgh, PA, USA.
Addiction. 2017 Dec;112(12):2167-2177. doi: 10.1111/add.13886. Epub 2017 Jul 4.
To (1) assess trends and variation in the market share of product types and potency sold in a legal cannabis retail market and (2) estimate how potency and purchase quantity influence price variation for cannabis flower.
Secondary analysis of publicly available data from Washington State's cannabis traceability system spanning 7 July 2014 to 30 September 2016. Descriptive statistics and linear regressions assessed variation and trends in cannabis product variety and potency. Hedonic regressions estimated how purchase quantity and potency influence cannabis flower price variation.
Washington State, USA.
(1) A total of 44 482 176 million cannabis purchases, including (2) 31 052 123 cannabis flower purchases after trimming price and quantity outliers.
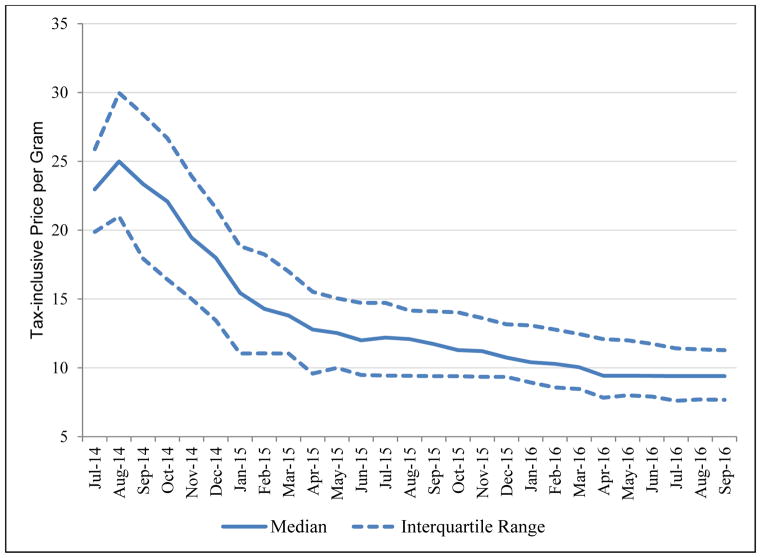
Primary outcome measures were (1) monthly expenditures on cannabis, total delta-9-tetrahydrocannabinol (THC) concentration and cannabidiol (CBD) concentration by product type and (2) excise tax-inclusive price per gram of cannabis flower. Key covariates for the hedonic price regressions included quantity purchased, THC and CBD.
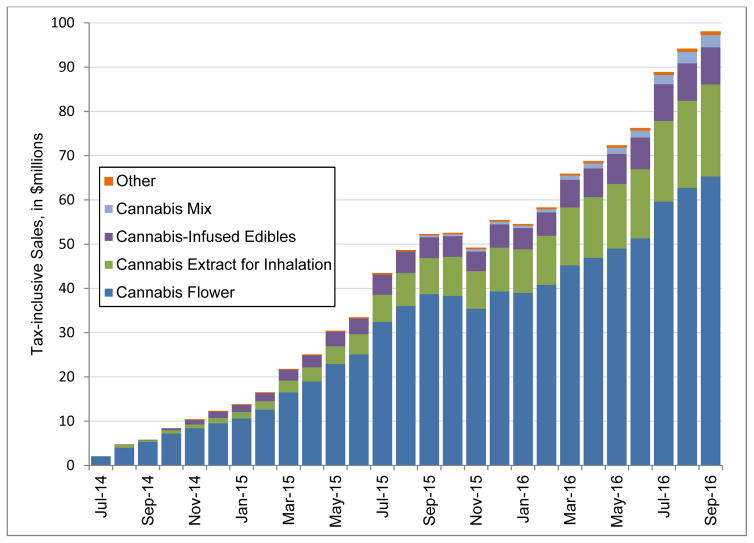
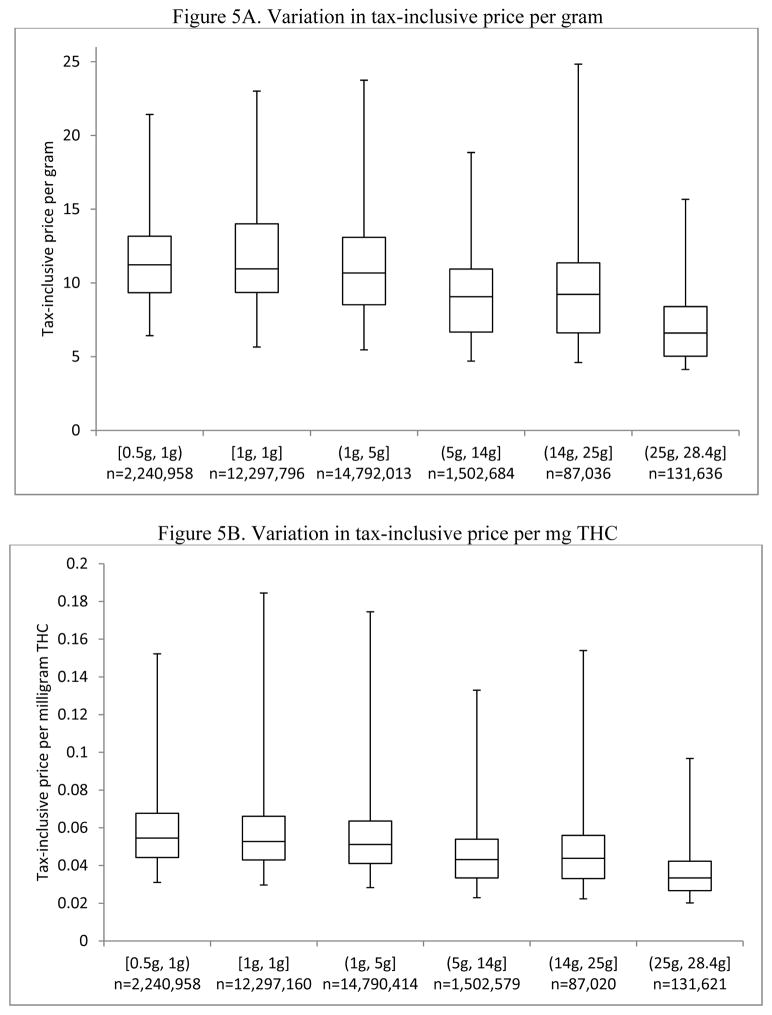
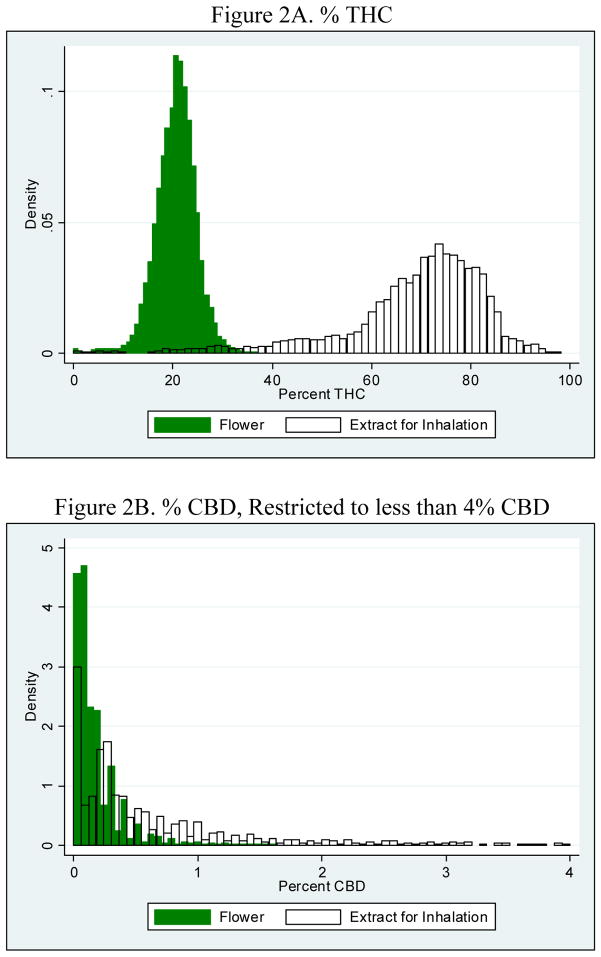
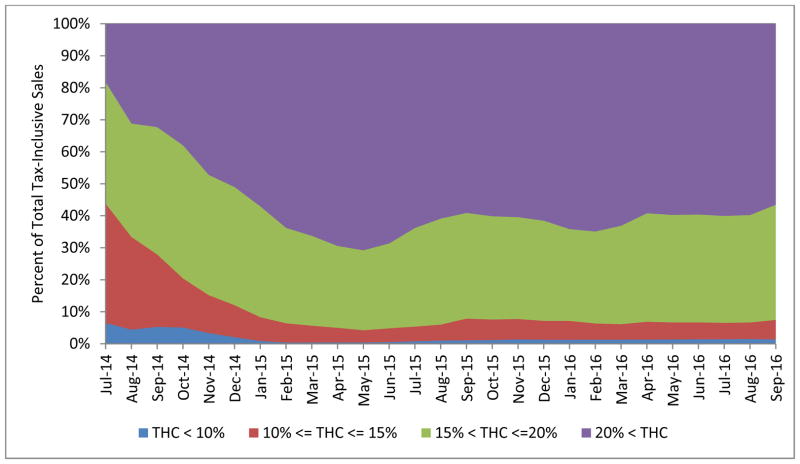
Traditional cannabis flowers still account for the majority of spending (66.6%), but the market share of extracts for inhalation increased by 145.8% between October 2014 and September 2016, now comprising 21.2% of sales. The average THC-level for cannabis extracts is more than triple that for cannabis flowers (68.7% compared to 20.6%). For flower products, there is a statistically significant relationship between price per gram and both THC [coefficient = 0.012; 95% confidence interval (CI) = 0.011-0.013] and CBD (coefficient = 0.017; CI = 0.015-0.019). The estimated discount elasticity is -0.06 (CI = -0.07 to -0.05).
In the state of Washington, USA, the legal cannabis market is currently dominated by high-THC cannabis flower, and features growing expenditures on extracts. For cannabis flower, both THC and CBD are associated with higher per-gram prices, and there are small but significant quantity discounts.
(1)评估在合法大麻零售市场中销售的产品类型和效力的市场份额的趋势和变化,(2)估计效力和购买数量如何影响大麻花的价格变化。
对 2014 年 7 月 7 日至 2016 年 9 月 30 日华盛顿州大麻可追溯系统公开数据的二次分析。描述性统计和线性回归评估了大麻产品种类和效力的变化和趋势。享乐回归估计了购买数量和效力如何影响大麻花价格变化。
美国华盛顿州。
(1)共 44482176 次大麻购买,包括(2)剔除价格和数量异常值后 31052123 次大麻花购买。
主要结果指标是(1)按产品类型计算的每月大麻支出、总 delta-9-四氢大麻酚(THC)浓度和大麻二酚(CBD)浓度,(2)含消费税的每克大麻花价格。享乐价格回归的关键协变量包括购买数量、THC 和 CBD。
传统大麻花仍然占支出的大部分(66.6%),但 2014 年 10 月至 2016 年 9 月期间吸入用提取物的市场份额增长了 145.8%,现在占销售额的 21.2%。大麻提取物的平均 THC 水平是大麻花的三倍多(68.7%比 20.6%)。对于花产品,每克价格与 THC [系数=0.012;95%置信区间(CI)=0.011-0.013]和 CBD(系数=0.017;CI=0.015-0.019)之间存在统计学上的显著关系。估计的折扣弹性为-0.06(CI=-0.07 至-0.05)。
在美国华盛顿州,合法大麻市场目前以高 THC 大麻花为主导,并且在提取物上的支出不断增加。对于大麻花,THC 和 CBD 都与更高的每克价格相关,并且存在小但显著的数量折扣。