Lyon Aurore, Ariga Rina, Mincholé Ana, Mahmod Masliza, Ormondroyd Elizabeth, Laguna Pablo, de Freitas Nando, Neubauer Stefan, Watkins Hugh, Rodriguez Blanca
Department of Computer Science, University of Oxford, Oxford, United Kingdom.
Division of Cardiovascular Medicine, Radcliffe Department of Medicine, University of Oxford, Oxford, United Kingdom.
Front Physiol. 2018 Mar 13;9:213. doi: 10.3389/fphys.2018.00213. eCollection 2018.
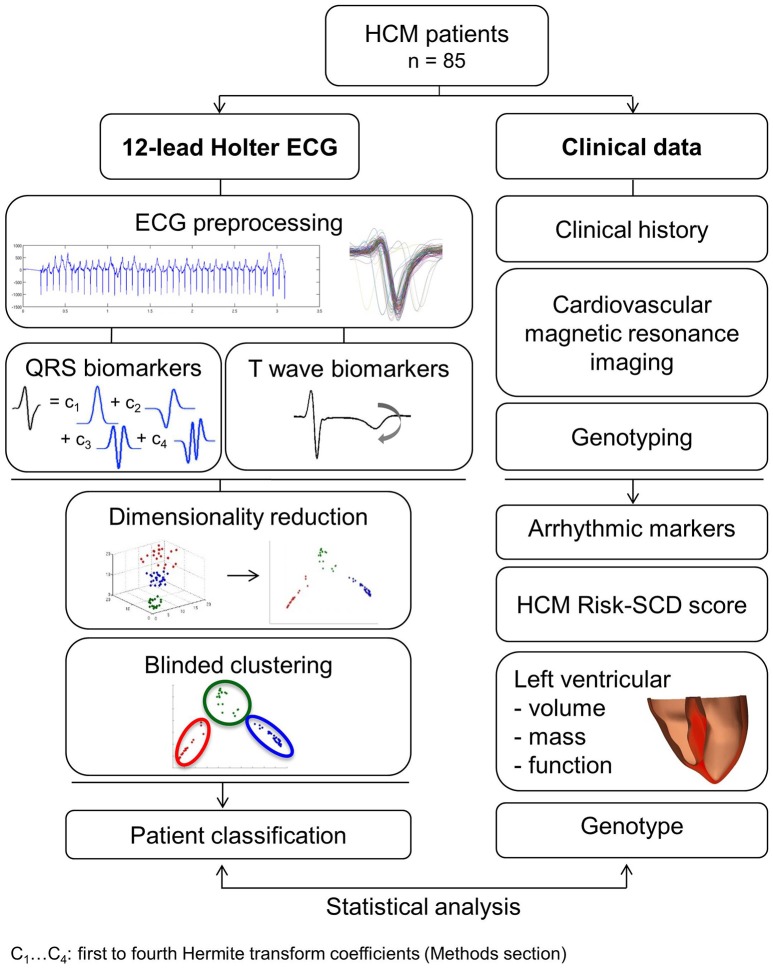
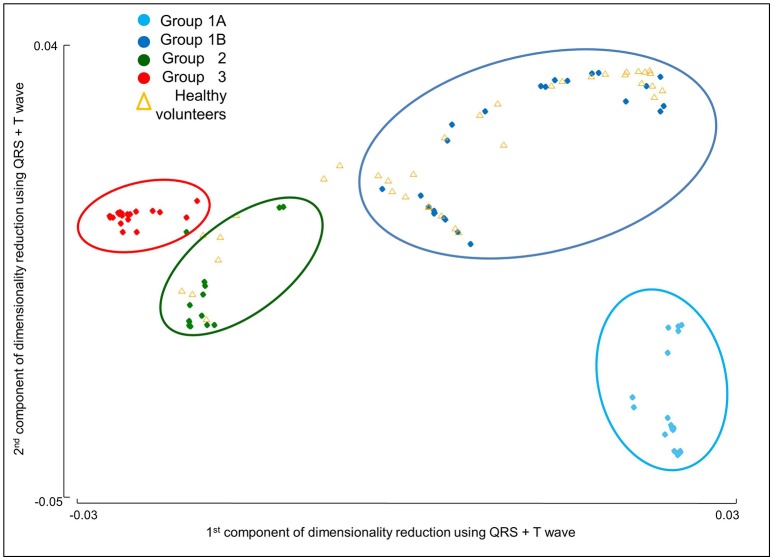
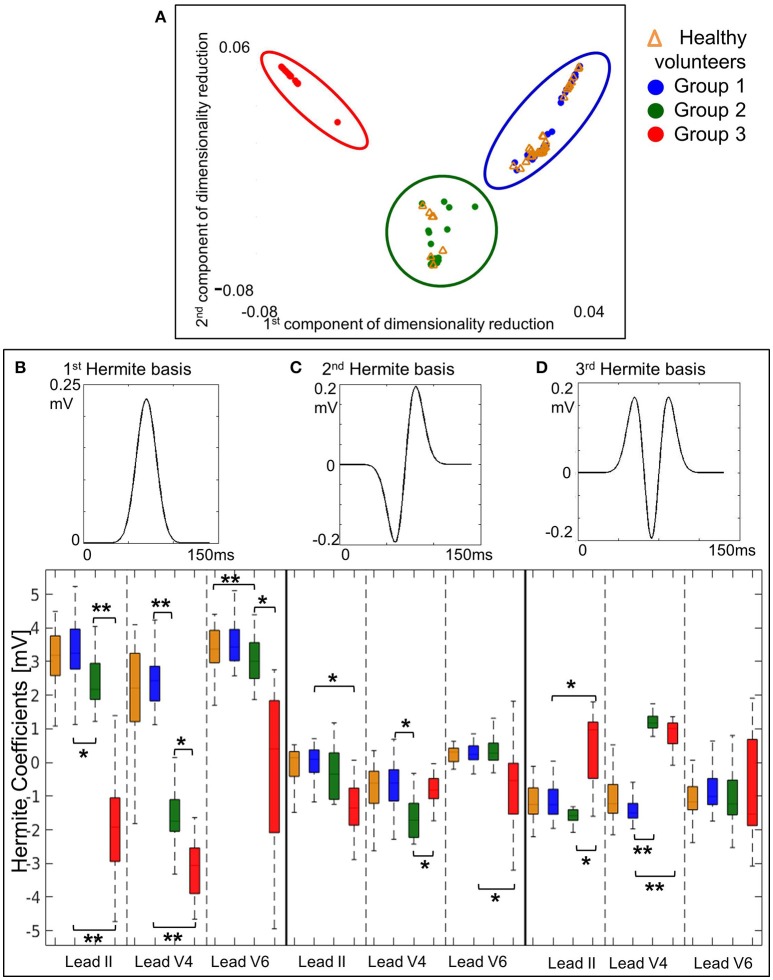
Ventricular arrhythmia triggers sudden cardiac death (SCD) in hypertrophic cardiomyopathy (HCM), yet electrophysiological biomarkers are not used for risk stratification. Our aim was to identify distinct HCM phenotypes based on ECG computational analysis, and characterize differences in clinical risk factors and anatomical differences using cardiac magnetic resonance (CMR) imaging. High-fidelity 12-lead Holter ECGs from 85 HCM patients and 38 healthy volunteers were analyzed using mathematical modeling and computational clustering to identify phenotypic subgroups. Clinical features and the extent and distribution of hypertrophy assessed by CMR were evaluated in the subgroups. QRS morphology alone was crucial to identify three HCM phenotypes with very distinct QRS patterns. Group 1 ( = 44) showed normal QRS morphology, Group 2 ( = 19) showed short R and deep S waves in V4, and Group 3 ( = 22) exhibited short R and long S waves in V4-6, and left QRS axis deviation. However, no differences in arrhythmic risk or distribution of hypertrophy were observed between these groups. Including T wave biomarkers in the clustering, four HCM phenotypes were identified: Group 1A ( = 20), with primary repolarization abnormalities showing normal QRS yet inverted T waves, Group 1B ( = 24), with normal QRS morphology and upright T waves, and Group 2 and Group 3 remaining as before, with upright T waves. Group 1A patients, with normal QRS and inverted T wave, showed increased HCM Risk-SCD scores (1A: 4.0%, 1B: 1.8%, 2: 2.1%, 3: 2.5%, = 0.0001), and a predominance of coexisting septal and apical hypertrophy ( < 0.0001). HCM patients in Groups 2 and 3 exhibited predominantly septal hypertrophy (85 and 90%, respectively). HCM patients were classified in four subgroups with distinct ECG features. Patients with primary T wave inversion not secondary to QRS abnormalities had increased HCM Risk-SCD scores and coexisting septal and apical hypertrophy, suggesting that primary T wave inversion may increase SCD risk in HCM, rather than T wave inversion secondary to depolarization abnormalities. Computational ECG phenotyping provides insight into the underlying processes captured by the ECG and has the potential to be a novel and independent factor for risk stratification.
室性心律失常会引发肥厚型心肌病(HCM)患者的心源性猝死(SCD),然而电生理生物标志物尚未用于风险分层。我们的目的是基于心电图计算分析识别不同的HCM表型,并使用心脏磁共振(CMR)成像来描述临床风险因素和解剖差异。使用数学建模和计算聚类分析了85例HCM患者和38名健康志愿者的高保真12导联动态心电图,以识别表型亚组。对亚组中的临床特征以及通过CMR评估的肥厚程度和分布进行了评估。仅QRS形态对于识别具有非常不同QRS模式的三种HCM表型至关重要。第1组(n = 44)显示QRS形态正常,第2组(n = 19)在V4导联显示R波短和S波深,第3组(n = 22)在V4 - 6导联表现为R波短和S波长,且QRS电轴左偏。然而,这些组之间在心律失常风险或肥厚分布方面未观察到差异。将T波生物标志物纳入聚类分析后,识别出四种HCM表型:第1A组(n = 20),主要表现为复极异常,QRS正常但T波倒置;第1B组(n = 24),QRS形态正常且T波直立;第2组和第3组保持不变,T波直立。第1A组患者,QRS正常但T波倒置,显示HCM风险 - SCD评分增加(1A组:4.0%,1B组:1.8%,2组:2.1%,3组:2.5%,P = 0.0001),并且共存的室间隔和心尖肥厚占优势(P < 0.0001)。第2组和第3组的HCM患者主要表现为室间隔肥厚(分别为85%和90%)。HCM患者被分为具有不同心电图特征的四个亚组。原发性T波倒置而非继发于QRS异常的患者,其HCM风险 - SCD评分增加且共存室间隔和心尖肥厚,这表明原发性T波倒置可能增加HCM患者的SCD风险,而不是继发于去极化异常的T波倒置。心电图计算表型分析有助于深入了解心电图所捕捉的潜在过程,并且有可能成为一种新的独立风险分层因素。