Khan Sikandar Hayat, Sobia Farah, Niazi Najmusaqib Khan, Manzoor Syed Mohsin, Fazal Nadeem, Ahmad Fowad
Department of Pathology, PNS HAFEEZ, Islamabad, Pakistan.
CMH Multan, Lahore, Pakistan.
Diabetol Metab Syndr. 2018 Oct 5;10:74. doi: 10.1186/s13098-018-0376-8. eCollection 2018.
Metabolic syndrome over the years have structured definitions to classify an individual with the disease. Literature review suggests insulin résistance is hallmark of these metabolic clustering. While measuring insulin resistance directly or indirectly remains technically difficult in general practice, along with multiple stability issues for insulin, various indirect measures have been suggested by authorities. Fasting triglycerides-glucose (TyG) index is one such marker, which is recently been suggested as a useful diagnostic marker to predict metabolic syndrome. However, limited data is available on the subject with almost no literature from our region on the subject.
DESIGN-CROSS-SECTIONAL ANALYSIS: Place and duration of study-From Jun-2016 to July-2017 at PSS HAFEEZ hospital Islamabad.
From a finally selected sample size of 227 male and female subjects we evaluated their anthropometric data, HbA1c, lipid profile including calculated sdLDLc, urine albumin creatinine raito(UACR) and insulin resistance (HOMAIR). TyG index was calculated using formula of Simental-Mendía LE et al. Aforementioned parameters were correlated with TyG index, differences between subjects with and without metabolic syndrome were calculated using Independent sample t-test. Finally ROC curve analysis was carried out to measure AUC for candidate parameters including TyG Index for comparison.
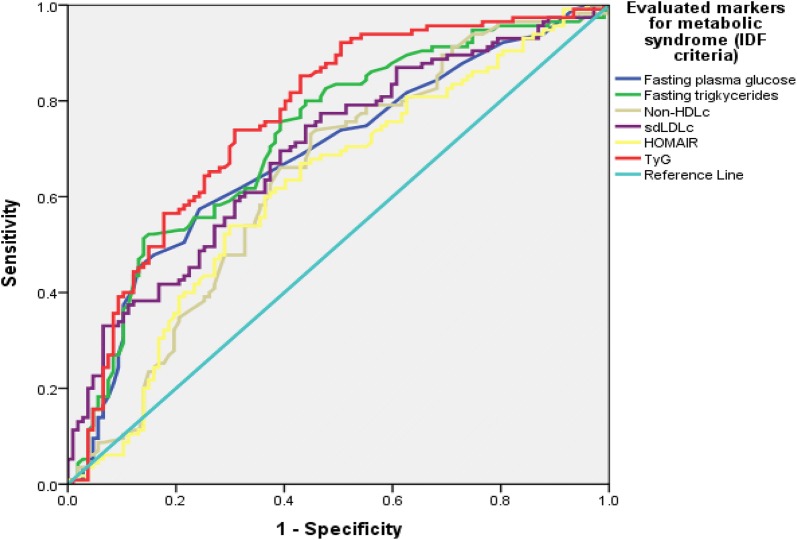
TyG index in comparison to other markers like fasting triglycerides, HOMAIR, HDLc and non-HDLc demonstrated higher positive linear correlation with BMI, atherogenic dyslipidemia (sdLDLc), nephropathy (UACR), HbA1c and insulin resistance. TyG index showed significant differences between various markers among subjects with and without metabolic syndrome as per IDF criteria. AUC (Area Under Curve) demonstrated highest AUC for TyG as [(0.764, 95% CI 0.700-0.828, p-value ≤ 0.001)] followed by fasting triglycerides [(0.724, 95% CI 0.656-0.791, p-value ≤ 0.001)], sdLDLc [(0.695, 95% CI 0.626-0.763, p-value ≤ 0.001)], fasting plasma glucose [(0.686, 95% CI 0.616-0.756, p-value ≤ 0.001)], Non-HDLc [(0.640, 95% CI 0.626-0.763, p-value ≤ 0.001)] and HOMAIR [(0.619, 95% CI 0.545-0.694, p-value ≤ 0.001)].
TyG index, having the highest AUC in comparison to fasting glucose, triglycerides, sdLDLc, non-HDLc and HOMAIR can act as better marker for diagnosing metabolic syndrome.
多年来,代谢综合征已有结构化定义用于对患有该疾病的个体进行分类。文献综述表明胰岛素抵抗是这些代谢聚集的标志。虽然在一般实践中直接或间接测量胰岛素抵抗在技术上仍然困难,并且胰岛素存在多种稳定性问题,但权威机构已提出了各种间接测量方法。空腹甘油三酯 - 葡萄糖(TyG)指数就是这样一种标志物,最近它被认为是预测代谢综合征的一种有用的诊断标志物。然而,关于该主题的数据有限,我们所在地区几乎没有相关文献。
设计 - 横断面分析:研究地点和时间 - 2016年6月至2017年7月在伊斯兰堡的PSS哈菲兹医院。
从最终选定的227名男性和女性受试者样本中,我们评估了他们的人体测量数据、HbA1c、血脂谱(包括计算得出的sdLDLc)、尿白蛋白肌酐比值(UACR)和胰岛素抵抗(稳态模型评估胰岛素抵抗指数,HOMAIR)。TyG指数使用西门塔尔 - 门迪亚等人的公式计算。将上述参数与TyG指数进行关联,使用独立样本t检验计算患有和未患有代谢综合征的受试者之间的差异。最后进行ROC曲线分析以测量包括TyG指数在内的候选参数的曲线下面积(AUC)进行比较。
与空腹甘油三酯、HOMAIR、高密度脂蛋白胆固醇(HDLc)和非高密度脂蛋白胆固醇等其他标志物相比,TyG指数与体重指数(BMI)、致动脉粥样硬化血脂异常(sdLDLc)、肾病(UACR)、HbA1c和胰岛素抵抗呈现出更高的正线性相关性。根据国际糖尿病联盟(IDF)标准,TyG指数在患有和未患有代谢综合征的受试者中的各种标志物之间显示出显著差异。AUC(曲线下面积)显示TyG的AUC最高[(0.764,95%置信区间0.700 - 0.828,p值≤0.001)],其次是空腹甘油三酯[(0.724, 95%置信区间0.656 - 0.791,p值≤0.001)]、sdLDLc[(0.695, 95%置信区间0.626 - 0.763,p值≤0.001)]、空腹血糖[(0.686, 95%置信区间0.616 - 0.756,p值≤0.001)]、非HDLc[(0.640, 95%置信区间0.564 - 0.716,p值≤0.001)]和HOMAIR[(0.619, 95%置信区间0.545 - 0.694,p值≤0.001)]。
与空腹血糖、甘油三酯、sdLDLc、非HDLc和HOMAIR相比,TyG指数具有最高的AUC,可作为诊断代谢综合征的更好标志物。