• 文献检索
  • 文档翻译
  • 深度研究
  • 学术资讯
  • Suppr Zotero 插件Zotero 插件
  • 邀请有礼
  • 套餐&价格
  • 历史记录
应用&插件
Suppr Zotero 插件Zotero 插件浏览器插件Mac 客户端Windows 客户端微信小程序
定价
高级版会员购买积分包购买API积分包
服务
文献检索文档翻译深度研究API 文档MCP 服务
关于我们
关于 Suppr公司介绍联系我们用户协议隐私条款
关注我们

Suppr 超能文献

核心技术专利:CN118964589B侵权必究
粤ICP备2023148730 号-1Suppr @ 2026

文献检索

告别复杂PubMed语法,用中文像聊天一样搜索,搜遍4000万医学文献。AI智能推荐,让科研检索更轻松。

立即免费搜索

文件翻译

保留排版,准确专业,支持PDF/Word/PPT等文件格式,支持 12+语言互译。

免费翻译文档

深度研究

AI帮你快速写综述,25分钟生成高质量综述,智能提取关键信息,辅助科研写作。

立即免费体验

花粉浓度与众包症状数据的关联:来自2013年至2017年维也纳每日和季节性症状负荷指数数据的新见解。

The connection of pollen concentrations and crowd-sourced symptom data: new insights from daily and seasonal symptom load index data from 2013 to 2017 in Vienna.

作者信息

Bastl Katharina, Kmenta Maximilian, Berger Markus, Berger Uwe

机构信息

1Aerobiology and Pollen Information Research Unit, Department of Oto-Rhino-Laryngology, Medical University of Vienna, Währinger Gürtel 18-20, 1090 Vienna, Austria.

2Paracelsus Medizinische Privatuniversität, Strubergasse 21, 5020 Salzburg, Austria.

出版信息

World Allergy Organ J. 2018 Oct 16;11(1):24. doi: 10.1186/s40413-018-0203-6. eCollection 2018.

DOI:10.1186/s40413-018-0203-6
PMID:30349618
原文链接:https://pmc.ncbi.nlm.nih.gov/articles/PMC6190540/
Abstract

BACKGROUND

Online pollen diaries and mobile applications nowadays allow easy and fast documentation of pollen allergy symptoms. Such crowd-sourced symptom data provides insights into the development and the onset of a pollen allergy. Hitherto studies of the symptom load index (SLI) showed a discrepancy between the SLI and the total pollen amount of a season, but did not analyze the daily data.

METHODS

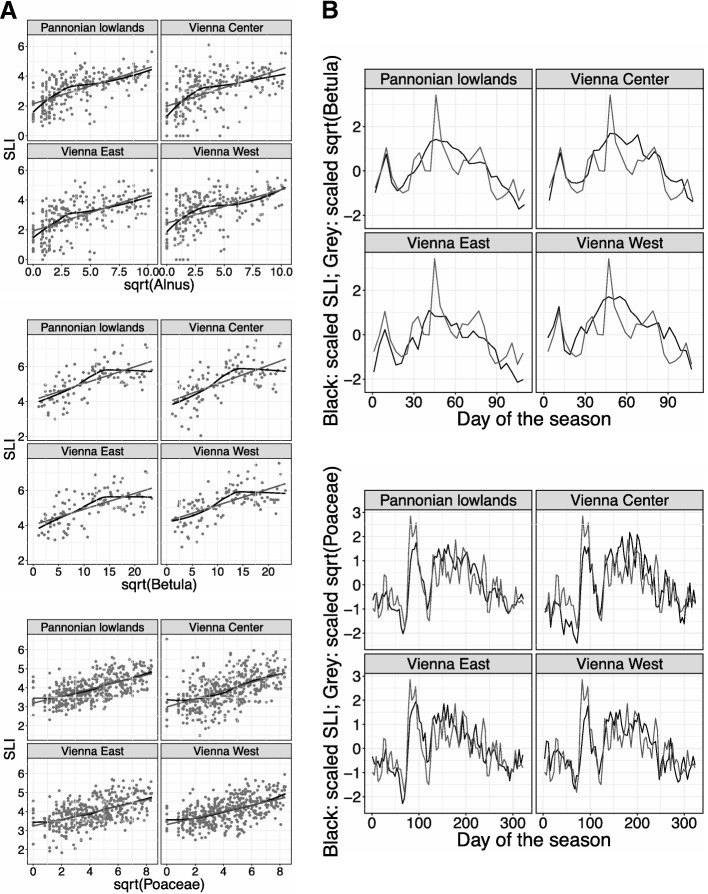
The Patient's Hayfever Diary (PHD) was used as data pool for symptom data. Symptom data of Vienna (Austria) was chosen as a large and local sample size within the study period of 2013 until 2017. The city was divided into three different areas based on equal population densities and different environmental factors. Correlation factors, regression lines, locally weighted smoothing (LOESS) curves and line plots were calculated to examine the data.

RESULTS

Daily SLI and pollen concentration data correlates well and the progress of the SLI within a pollen season is mirrored by the pollen concentrations. The LOESS curves do not deviate much from the regression line and support the linearity of the symptom-pollen correlation on a daily basis. Seasonal SLI data does not follow the same pattern as the respective seasonal pollen indices. Results did not vary in the three areas within Vienna or when compared with the Eastern region of Austria showing no significant spatial variation of the SLI.

DISCUSSION

Results indicate a linear relationship of the SLI and pollen concentrations/seasonal polllen index (SPIn) on a daily basis for both in general and throughout the season, but not on a seasonal basis. These findings clarify the frequent misinterpretation of the SLI as index that is tightly connected to pollen concentrations, but reflects as well the seasonal variation of the burden of pollen allergy sufferers.

CONCLUSION

More than just the seasonal pollen index has to be considered when the SLI of a selected pollen season has to be explained. Cross-reactivity to other pollen types, allergen content and air pollution could play a considerable role. The similar behavior of the SLI in Vienna and a whole region indicate the feasibility of a possible symptom forecast in future and justifies the use of a single pollen monitoring station within a city of the size of Vienna.

摘要

背景

如今,在线花粉日记和移动应用程序使花粉过敏症状的记录变得轻松快捷。这种众包的症状数据为了解花粉过敏的发展和发作提供了线索。迄今为止,对症状负荷指数(SLI)的研究表明,SLI与一个季节的总花粉量之间存在差异,但未对每日数据进行分析。

方法

将患者花粉热日记(PHD)用作症状数据的数据库。选择奥地利维也纳在2013年至2017年研究期间的症状数据作为一个大型的本地样本。根据相等的人口密度和不同的环境因素,将该市划分为三个不同的区域。计算相关因子、回归线、局部加权平滑(LOESS)曲线和线图以检验数据。

结果

每日SLI与花粉浓度数据相关性良好,花粉季节内SLI的变化趋势与花粉浓度一致。LOESS曲线与回归线偏差不大,支持了症状与花粉相关性在每日基础上的线性关系。季节性SLI数据与相应的季节性花粉指数模式不同。在维也纳的三个区域内,以及与奥地利东部地区相比,结果没有差异,表明SLI没有显著的空间变化。

讨论

结果表明,SLI与花粉浓度/季节性花粉指数(SPIn)在每日基础上总体以及整个季节都呈线性关系,但在季节性基础上并非如此。这些发现澄清了人们经常将SLI误解为与花粉浓度紧密相关的指数,同时也反映了花粉过敏患者负担的季节性变化。

结论

在解释选定花粉季节的SLI时,需要考虑的不仅仅是季节性花粉指数。对其他花粉类型的交叉反应、过敏原含量和空气污染可能起着相当大的作用。维也纳和整个地区SLI的相似表现表明未来进行症状预测具有可行性,也证明了在维也纳这样规模的城市中使用单个花粉监测站的合理性。

https://cdn.ncbi.nlm.nih.gov/pmc/blobs/007b/6190540/b744198d5420/40413_2018_203_Fig1_HTML.jpg

相似文献

1
The connection of pollen concentrations and crowd-sourced symptom data: new insights from daily and seasonal symptom load index data from 2013 to 2017 in Vienna.花粉浓度与众包症状数据的关联:来自2013年至2017年维也纳每日和季节性症状负荷指数数据的新见解。
World Allergy Organ J. 2018 Oct 16;11(1):24. doi: 10.1186/s40413-018-0203-6. eCollection 2018.
2
Variability of grass pollen allergy symptoms throughout the season: Comparing symptom data profiles from the Patient's Hayfever Diary from 2014 to 2016 in Vienna (Austria).整个季节中草花粉过敏症状的变异性:比较2014年至2016年奥地利维也纳患者花粉热日记中的症状数据概况。
World Allergy Organ J. 2021 Feb 27;14(3):100518. doi: 10.1016/j.waojou.2021.100518. eCollection 2021 Mar.
3
Translating the Burden of Pollen Allergy Into Numbers Using Electronically Generated Symptom Data From the Patient's Hayfever Diary in Austria and Germany: 10-Year Observational Study.利用奥地利和德国患者花粉热日记中的电子生成症状数据将花粉过敏负担转化为数字:10年观察性研究
J Med Internet Res. 2020 Feb 21;22(2):e16767. doi: 10.2196/16767.
4
First comparison of symptom data with allergen content (Bet v 1 and Phl p 5 measurements) and pollen data from four European regions during 2009-2011.首次对 2009-2011 年四个欧洲地区的症状数据与变应原含量(Bet v 1 和 Phl p 5 测量值)和花粉数据进行比较。
Sci Total Environ. 2016 Apr 1;548-549:229-235. doi: 10.1016/j.scitotenv.2016.01.014. Epub 2016 Jan 21.
5
The evaluation of pollen concentrations with statistical and computational methods on rooftop and on ground level in Vienna - How to include daily crowd-sourced symptom data.维也纳屋顶和地面花粉浓度的统计与计算方法评估——如何纳入每日众包症状数据
World Allergy Organ J. 2019 May 9;12(5):100036. doi: 10.1016/j.waojou.2019.100036. eCollection 2019.
6
The grass pollen season 2014 in Vienna: A pilot study combining phenology, aerobiology and symptom data.2014 年维也纳花粉草季:结合物候学、空气生物学和症状数据的一项初步研究。
Sci Total Environ. 2016 Oct 1;566-567:1614-1620. doi: 10.1016/j.scitotenv.2016.06.059. Epub 2016 Jun 15.
7
The grass pollen season 2015: a proof of concept multi-approach study in three different European cities.2015年草花粉季节:在欧洲三个不同城市开展的概念验证性多方法研究
World Allergy Organ J. 2017 Sep 12;10(1):31. doi: 10.1186/s40413-017-0163-2. eCollection 2017.
8
Pollen information consumption as an indicator of pollen allergy burden.花粉信息消费作为花粉过敏负担的一个指标。
Wien Klin Wochenschr. 2016 Jan;128(1-2):59-67. doi: 10.1007/s00508-015-0855-y. Epub 2015 Sep 15.
9
Impact of air pollution on symptom severity during the birch, grass and ragweed pollen period in Vienna, Austria: Importance of O in 2010-2018.空气污染对奥地利维也纳桦树、草和豚草花粉期症状严重程度的影响:2010-2018 年 O 的重要性。
Environ Pollut. 2020 Aug;263(Pt A):114526. doi: 10.1016/j.envpol.2020.114526. Epub 2020 Apr 6.
10
Can we improve pollen season definitions by using the symptom load index in addition to pollen counts?除了花粉计数之外,我们能否通过使用症状负荷指数来改进花粉季节的定义?
Environ Pollut. 2015 Sep;204:109-16. doi: 10.1016/j.envpol.2015.04.016. Epub 2015 May 2.

引用本文的文献

1
Pollen grading prediction scale for patients with Artemisia pollen allergy in China: A 3-day moving predictive model.中国蒿属花粉过敏患者的花粉分级预测量表:一种3天移动预测模型。
Clin Transl Allergy. 2023 Jul;13(7):e12280. doi: 10.1002/clt2.12280.
2
The Clinical Significance of Pollen and Fungi Concentrations for Allergic Rhinitis: A Three-Year Study.花粉和真菌浓度对变应性鼻炎的临床意义:一项为期三年的研究
Cureus. 2023 Jun 14;15(6):e40397. doi: 10.7759/cureus.40397. eCollection 2023 Jun.
3
Real-life evidence in allergen immunotherapy: Moving forward with mHealth apps.

本文引用的文献

1
The grass pollen season 2015: a proof of concept multi-approach study in three different European cities.2015年草花粉季节:在欧洲三个不同城市开展的概念验证性多方法研究
World Allergy Organ J. 2017 Sep 12;10(1):31. doi: 10.1186/s40413-017-0163-2. eCollection 2017.
2
The medical and scientific responsibility of pollen information services.花粉信息服务的医学与科学责任。
Wien Klin Wochenschr. 2017 Jan;129(1-2):70-74. doi: 10.1007/s00508-016-1097-3. Epub 2016 Oct 19.
3
Pollen-Associated Microbiome Correlates with Pollution Parameters and the Allergenicity of Pollen.
变应原免疫疗法的真实世界证据:借助移动健康应用程序向前发展。
Allergol Select. 2023 Mar 1;7:47-56. doi: 10.5414/ALX02343E. eCollection 2023.
4
Real-world data using mHealth apps in rhinitis, rhinosinusitis and their multimorbidities.使用移动健康应用程序获取的关于鼻炎、鼻窦炎及其合并症的真实世界数据。
Clin Transl Allergy. 2022 Nov;12(11):e12208. doi: 10.1002/clt2.12208.
5
A systematic review of the effects of temperature and precipitation on pollen concentrations and season timing, and implications for human health.温度和降水对花粉浓度和季节时间的影响的系统评价,及其对人类健康的影响。
Int J Biometeorol. 2021 Oct;65(10):1615-1628. doi: 10.1007/s00484-021-02128-7. Epub 2021 Apr 20.
6
Assessment of Google Trends terms reporting allergies and the grass pollen season in Ukraine.对乌克兰谷歌趋势中报告过敏和草花粉季节相关词汇的评估。
World Allergy Organ J. 2020 Sep 30;13(10):100465. doi: 10.1016/j.waojou.2020.100465. eCollection 2020 Oct.
7
Digital technologies for an improved management of respiratory allergic diseases: 10 years of clinical studies using an online platform for patients and physicians.数字技术在改善呼吸道过敏性疾病管理中的应用:使用在线医患平台进行临床研究的 10 年回顾
Ital J Pediatr. 2020 Jul 25;46(1):105. doi: 10.1186/s13052-020-00870-z.
8
Translating the Burden of Pollen Allergy Into Numbers Using Electronically Generated Symptom Data From the Patient's Hayfever Diary in Austria and Germany: 10-Year Observational Study.利用奥地利和德国患者花粉热日记中的电子生成症状数据将花粉过敏负担转化为数字:10年观察性研究
J Med Internet Res. 2020 Feb 21;22(2):e16767. doi: 10.2196/16767.
9
The evaluation of pollen concentrations with statistical and computational methods on rooftop and on ground level in Vienna - How to include daily crowd-sourced symptom data.维也纳屋顶和地面花粉浓度的统计与计算方法评估——如何纳入每日众包症状数据
World Allergy Organ J. 2019 May 9;12(5):100036. doi: 10.1016/j.waojou.2019.100036. eCollection 2019.
10
Shortened up-dosing with sublingual immunotherapy drops containing tree allergens is well tolerated and elicits dose-dependent clinical effects during the first pollen season.含有树木过敏原的舌下免疫治疗滴剂缩短给药方案耐受性良好,并在第一个花粉季节引发剂量依赖性临床效果。
World Allergy Organ J. 2019 Mar 8;12(2):100012. doi: 10.1016/j.waojou.2019.100012. eCollection 2019.
与花粉相关的微生物群与污染参数及花粉的致敏性相关。
PLoS One. 2016 Feb 24;11(2):e0149545. doi: 10.1371/journal.pone.0149545. eCollection 2016.
4
First comparison of symptom data with allergen content (Bet v 1 and Phl p 5 measurements) and pollen data from four European regions during 2009-2011.首次对 2009-2011 年四个欧洲地区的症状数据与变应原含量(Bet v 1 和 Phl p 5 测量值)和花粉数据进行比较。
Sci Total Environ. 2016 Apr 1;548-549:229-235. doi: 10.1016/j.scitotenv.2016.01.014. Epub 2016 Jan 21.
5
Pollen information consumption as an indicator of pollen allergy burden.花粉信息消费作为花粉过敏负担的一个指标。
Wien Klin Wochenschr. 2016 Jan;128(1-2):59-67. doi: 10.1007/s00508-015-0855-y. Epub 2015 Sep 15.
6
Can we improve pollen season definitions by using the symptom load index in addition to pollen counts?除了花粉计数之外,我们能否通过使用症状负荷指数来改进花粉季节的定义?
Environ Pollut. 2015 Sep;204:109-16. doi: 10.1016/j.envpol.2015.04.016. Epub 2015 May 2.
7
Pilot study on the short-term prediction of symptoms in children with hay fever monitored with e-Health technology.采用电子健康技术对花粉症儿童症状进行短期预测的初步研究。
Eur Ann Allergy Clin Immunol. 2014 Nov;46(6):216-25.
8
Spatiotemporal monitoring of allergic rhinitis symptoms in The Netherlands using citizen science.利用公民科学对荷兰过敏性鼻炎症状进行时空监测。
Allergy. 2014 Aug;69(8):1085-91. doi: 10.1111/all.12433. Epub 2014 Jun 3.
9
Development of personal pollen information-the next generation of pollen information and a step forward for hay fever sufferers.个人花粉信息的发展——下一代花粉信息,也是花粉热患者的一大进步。
Int J Biometeorol. 2014 Oct;58(8):1721-6. doi: 10.1007/s00484-013-0776-2. Epub 2013 Dec 20.
10
Grass pollen allergy in children and adolescents-symptoms, health related quality of life and the value of pollen prognosis.儿童和青少年的花粉过敏——症状、与健康相关的生活质量和花粉预测的价值。
Clin Transl Allergy. 2013 Jun 22;3:19. doi: 10.1186/2045-7022-3-19. eCollection 2013.