• 文献检索
  • 文档翻译
  • 深度研究
  • 学术资讯
  • Suppr Zotero 插件Zotero 插件
  • 邀请有礼
  • 套餐&价格
  • 历史记录
应用&插件
Suppr Zotero 插件Zotero 插件浏览器插件Mac 客户端Windows 客户端微信小程序
定价
高级版会员购买积分包购买API积分包
服务
文献检索文档翻译深度研究API 文档MCP 服务
关于我们
关于 Suppr公司介绍联系我们用户协议隐私条款
关注我们

Suppr 超能文献

核心技术专利:CN118964589B侵权必究
粤ICP备2023148730 号-1Suppr @ 2026

文献检索

告别复杂PubMed语法,用中文像聊天一样搜索,搜遍4000万医学文献。AI智能推荐,让科研检索更轻松。

立即免费搜索

文件翻译

保留排版,准确专业,支持PDF/Word/PPT等文件格式,支持 12+语言互译。

免费翻译文档

深度研究

AI帮你快速写综述,25分钟生成高质量综述,智能提取关键信息,辅助科研写作。

立即免费体验

印度各州儿童和孕产妇营养不良负担及其指标趋势:1990-2017 年全球疾病负担研究。

The burden of child and maternal malnutrition and trends in its indicators in the states of India: the Global Burden of Disease Study 1990-2017.

出版信息

Lancet Child Adolesc Health. 2019 Dec;3(12):855-870. doi: 10.1016/S2352-4642(19)30273-1. Epub 2019 Sep 18.

DOI:10.1016/S2352-4642(19)30273-1
PMID:31542357
原文链接:https://pmc.ncbi.nlm.nih.gov/articles/PMC6839043/
Abstract

BACKGROUND

Malnutrition is a major contributor to disease burden in India. To inform subnational action, we aimed to assess the disease burden due to malnutrition and the trends in its indicators in every state of India in relation to Indian and global nutrition targets.

METHODS

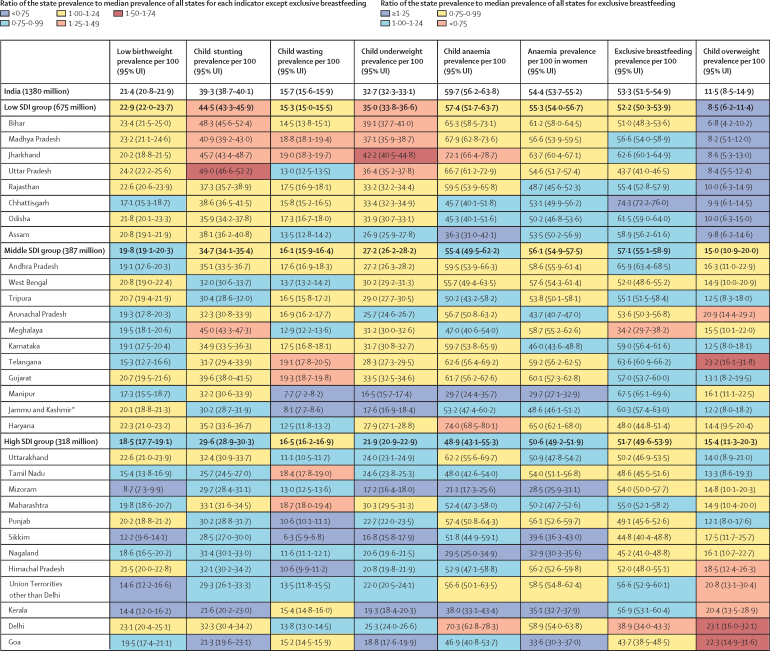
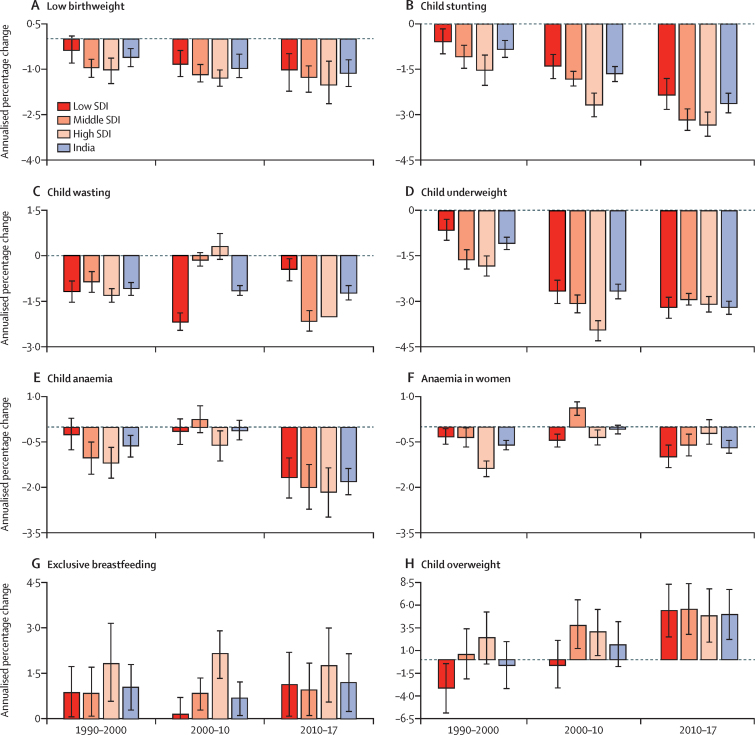
We analysed the disease burden attributable to child and maternal malnutrition, and the trends in the malnutrition indicators from 1990 to 2017 in every state of India using all accessible data from multiple sources, as part of Global Burden of Diseases, Injuries, and Risk Factors Study (GBD) 2017. The states were categorised into three groups using their Socio-demographic Index (SDI) calculated by GBD on the basis of per capita income, mean education, and fertility rate in women younger than 25 years. We projected the prevalence of malnutrition indicators for the states of India up to 2030 on the basis of the 1990-2017 trends for comparison with India National Nutrition Mission (NNM) 2022 and WHO and UNICEF 2030 targets.

FINDINGS

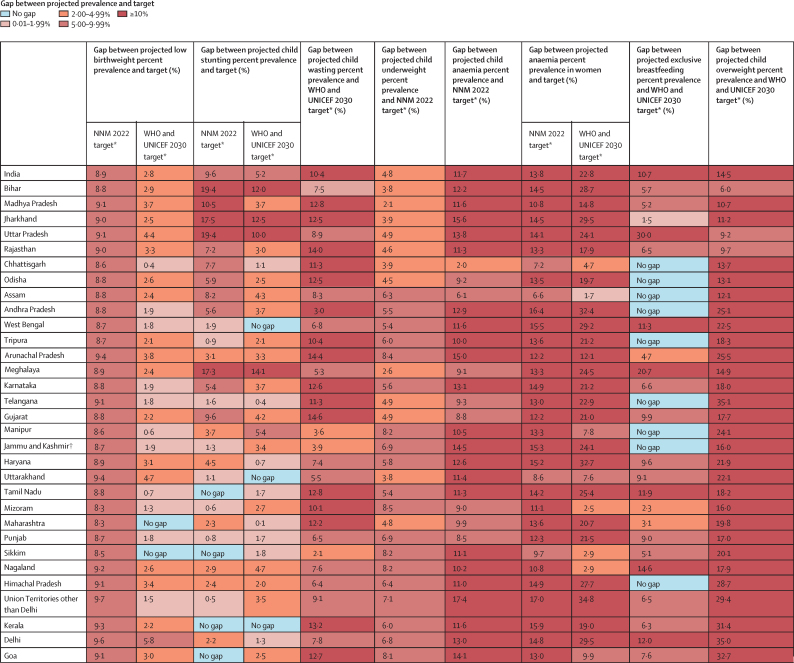
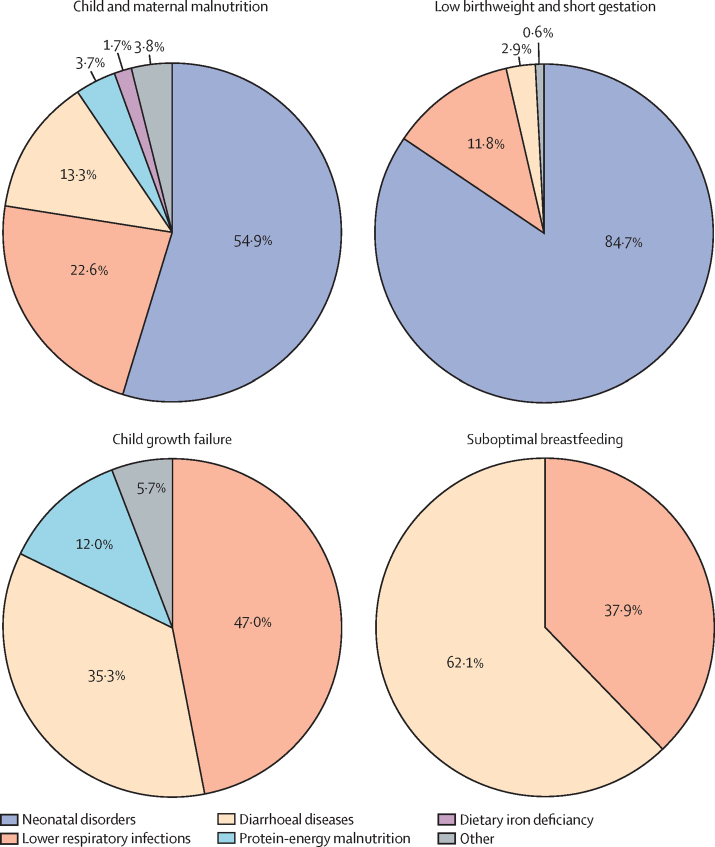
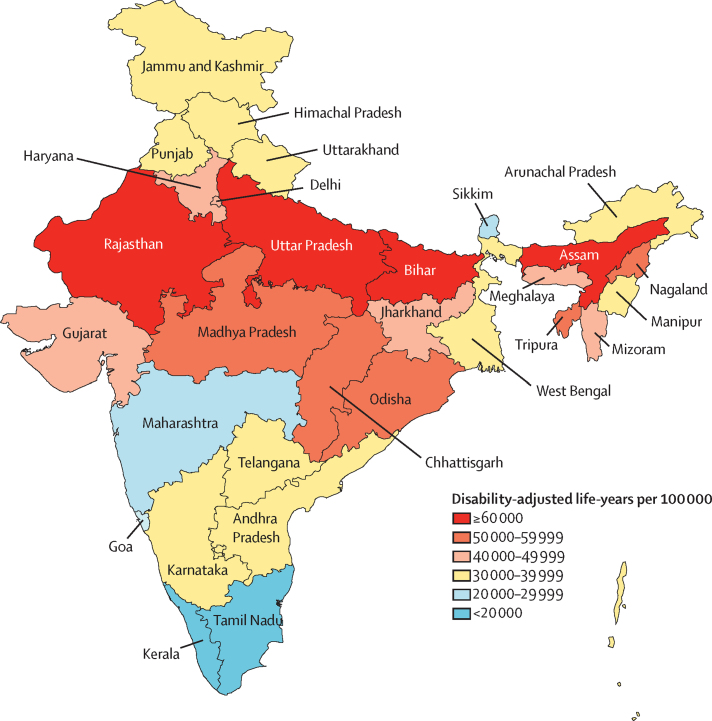
Malnutrition was the predominant risk factor for death in children younger than 5 years of age in every state of India in 2017, accounting for 68·2% (95% UI 65·8-70·7) of the total under-5 deaths, and the leading risk factor for health loss for all ages, responsible for 17·3% (16·3-18·2) of the total disability-adjusted life years (DALYs). The malnutrition DALY rate was much higher in the low SDI than in the middle SDI and high SDI state groups. This rate varied 6·8 times between the states in 2017, and was highest in the states of Uttar Pradesh, Bihar, Assam, and Rajasthan. The prevalence of low birthweight in India in 2017 was 21·4% (20·8-21·9), child stunting 39·3% (38·7-40·1), child wasting 15·7% (15·6-15·9), child underweight 32·7% (32·3-33·1), anaemia in children 59·7% (56·2-63·8), anaemia in women 15-49 years of age 54·4% (53·7-55·2), exclusive breastfeeding 53·3% (51·5-54·9), and child overweight 11·5% (8·5-14·9). If the trends estimated up to 2017 for the indicators in the NNM 2022 continue in India, there would be 8·9% excess prevalence for low birthweight, 9·6% for stunting, 4·8% for underweight, 11·7% for anaemia in children, and 13·8% for anaemia in women relative to the 2022 targets. For the additional indicators in the WHO and UNICEF 2030 targets, the trends up to 2017 would lead to 10·4% excess prevalence for wasting, 14·5% excess prevalence for overweight, and 10·7% less exclusive breastfeeding in 2030. The prevalence of malnutrition indicators, their rates of improvement, and the gaps between projected prevalence and targets vary substantially between the states.

INTERPRETATION

Malnutrition continues to be the leading risk factor for disease burden in India. It is encouraging that India has set ambitious targets to reduce malnutrition through NNM. The trends up to 2017 indicate that substantially higher rates of improvement will be needed for all malnutrition indicators in most states to achieve the Indian 2022 and the global 2030 targets. The state-specific findings in this report indicate the effort needed in each state, which will be useful in tracking and motivating further progress. Similar subnational analyses might be useful for other low-income and middle-income countries.

FUNDING

Bill & Melinda Gates Foundation; Indian Council of Medical Research, Department of Health Research, Ministry of Health and Family Welfare, Government of India.

https://cdn.ncbi.nlm.nih.gov/pmc/blobs/e5a5/6839043/c40605d0ac16/gr5.jpg
https://cdn.ncbi.nlm.nih.gov/pmc/blobs/e5a5/6839043/2c5936e1b8f6/gr1.jpg
https://cdn.ncbi.nlm.nih.gov/pmc/blobs/e5a5/6839043/3b3d242ebc93/gr2.jpg
https://cdn.ncbi.nlm.nih.gov/pmc/blobs/e5a5/6839043/92c0ce5d3fb5/gr3.jpg
https://cdn.ncbi.nlm.nih.gov/pmc/blobs/e5a5/6839043/5584978ca82c/gr4.jpg
https://cdn.ncbi.nlm.nih.gov/pmc/blobs/e5a5/6839043/c40605d0ac16/gr5.jpg
摘要

背景

营养不良是印度疾病负担的主要原因之一。为了为国家行动提供信息,我们旨在评估印度每个邦的营养不良相关疾病负担以及营养不良指标的趋势,同时考虑到印度和全球的营养目标。

方法

我们分析了儿童和孕产妇营养不良的疾病负担,以及 1990 年至 2017 年期间印度每个邦的营养不良指标的变化趋势,这些数据来自全球疾病、伤害和风险因素研究(GBD)2017 中的多个来源。根据 GBD 基于人均收入、平均教育水平和 25 岁以下女性生育率计算的社会发展指数(SDI),将各州分为三组。我们根据 1990-2017 年的趋势预测了印度各州的营养不良指标的患病率,以便与印度国家营养使命(NNM)2022 年和世界卫生组织(WHO)和联合国儿童基金会(UNICEF)2030 年的目标进行比较。

结果

在 2017 年,营养不良是印度每个邦 5 岁以下儿童死亡的主要原因,占总 5 岁以下儿童死亡人数的 68.2%(95%UI 65.8-70.7),也是所有年龄段健康损失的主要风险因素,占总残疾调整生命年(DALY)的 17.3%(16.3-18.2)。在低 SDI 州组中,营养不良的 DALY 率要高得多。2017 年,各州之间的这一比率相差 6.8 倍,最高的是北方邦、比哈尔邦、阿萨姆邦和拉贾斯坦邦。2017 年印度的低出生体重率为 21.4%(20.8-21.9),儿童发育迟缓率为 39.3%(38.7-40.1),儿童消瘦率为 15.7%(15.6-15.9),儿童体重不足率为 32.7%(32.3-33.1),儿童贫血率为 59.7%(56.2-63.8),15-49 岁妇女贫血率为 54.4%(53.7-55.2),纯母乳喂养率为 53.3%(51.5-54.9),儿童超重率为 11.5%(8.5-14.9)。如果按照 NNM 2022 年的指标趋势估计到 2017 年,那么低出生体重将增加 8.9%,发育迟缓将增加 9.6%,体重不足将增加 4.8%,儿童贫血将增加 11.7%,妇女贫血将增加 13.8%,与 2022 年的目标相比。对于 WHO 和 UNICEF 2030 年目标中的其他指标,到 2017 年的趋势将导致消瘦率增加 10.4%,超重率增加 14.5%,2030 年纯母乳喂养率降低 10.7%。

各州的营养不良指标的流行率、改善率以及与目标的差距差异很大。

解释

营养不良仍然是印度疾病负担的主要原因。令人鼓舞的是,印度已经制定了雄心勃勃的目标,通过 NNM 来减少营养不良。截至 2017 年的趋势表明,大多数州需要更高的改善率,才能实现印度 2022 年和全球 2030 年的目标。本报告中的州级发现表明了每个州需要做出的努力,这将有助于跟踪和激励进一步的进展。类似的国家内分析可能对其他低收入和中等收入国家有用。

经费

比尔及梅琳达·盖茨基金会;印度医学研究理事会,印度卫生部,印度家庭福利部,印度政府。

相似文献

1
The burden of child and maternal malnutrition and trends in its indicators in the states of India: the Global Burden of Disease Study 1990-2017.印度各州儿童和孕产妇营养不良负担及其指标趋势:1990-2017 年全球疾病负担研究。
Lancet Child Adolesc Health. 2019 Dec;3(12):855-870. doi: 10.1016/S2352-4642(19)30273-1. Epub 2019 Sep 18.
2
Subnational mapping of under-5 and neonatal mortality trends in India: the Global Burden of Disease Study 2000-17.印度五岁以下儿童和新生儿死亡率趋势的次国家级地图绘制:2000-2017 年全球疾病负担研究。
Lancet. 2020 May 23;395(10237):1640-1658. doi: 10.1016/S0140-6736(20)30471-2. Epub 2020 May 12.
3
The impact of air pollution on deaths, disease burden, and life expectancy across the states of India: the Global Burden of Disease Study 2017.空气污染对印度各邦居民死亡、疾病负担和预期寿命的影响:2017 年全球疾病负担研究。
Lancet Planet Health. 2019 Jan;3(1):e26-e39. doi: 10.1016/S2542-5196(18)30261-4. Epub 2018 Dec 6.
4
Mapping of variations in child stunting, wasting and underweight within the states of India: the Global Burden of Disease Study 2000-2017.印度各邦儿童发育迟缓、消瘦和体重不足情况的变化图谱:2000 - 2017年全球疾病负担研究
EClinicalMedicine. 2020 May 13;22:100317. doi: 10.1016/j.eclinm.2020.100317. eCollection 2020 May.
5
The burden of chronic respiratory diseases and their heterogeneity across the states of India: the Global Burden of Disease Study 1990-2016.印度各邦慢性呼吸道疾病负担及其异质性:1990-2016 年全球疾病负担研究。
Lancet Glob Health. 2018 Dec;6(12):e1363-e1374. doi: 10.1016/S2214-109X(18)30409-1. Epub 2018 Sep 12.
6
Nations within a nation: variations in epidemiological transition across the states of India, 1990-2016 in the Global Burden of Disease Study.一国之内的差异:1990-2016 年印度各邦的疾病流行转变的流行病学差异,全球疾病负担研究。
Lancet. 2017 Dec 2;390(10111):2437-2460. doi: 10.1016/S0140-6736(17)32804-0. Epub 2017 Nov 14.
7
The burden of mental disorders across the states of India: the Global Burden of Disease Study 1990-2017.印度各邦精神障碍负担:1990 - 2017年全球疾病负担研究
Lancet Psychiatry. 2020 Feb;7(2):148-161. doi: 10.1016/S2215-0366(19)30475-4. Epub 2019 Dec 23.
8
The increasing burden of diabetes and variations among the states of India: the Global Burden of Disease Study 1990-2016.糖尿病负担日益加重,印度各邦情况不一:1990-2016 年全球疾病负担研究。
Lancet Glob Health. 2018 Dec;6(12):e1352-e1362. doi: 10.1016/S2214-109X(18)30387-5. Epub 2018 Sep 12.
9
The burden of neurological disorders across the states of India: the Global Burden of Disease Study 1990-2019.印度各邦的神经障碍负担:1990-2019 年全球疾病负担研究。
Lancet Glob Health. 2021 Aug;9(8):e1129-e1144. doi: 10.1016/S2214-109X(21)00164-9. Epub 2021 Jul 14.
10
Global burden and strength of evidence for 88 risk factors in 204 countries and 811 subnational locations, 1990-2021: a systematic analysis for the Global Burden of Disease Study 2021.全球疾病负担研究 2021 年在 204 个国家和地区、811 个次国家级地点对 88 种风险因素的全球负担和证据强度:系统分析。
Lancet. 2024 May 18;403(10440):2162-2203. doi: 10.1016/S0140-6736(24)00933-4.

引用本文的文献

1
Effects of mothers' water, sanitation and hygiene habits on diarrhoea and malnutrition among children under 5 years in Nepal.尼泊尔母亲的水、环境卫生和个人卫生习惯对5岁以下儿童腹泻和营养不良的影响。
BMJ Public Health. 2025 Sep 3;3(2):e001815. doi: 10.1136/bmjph-2024-001815. eCollection 2025.
2
Prevalence and Determinants of Undernutrition in Under-Five Children in Urban Slums of Tripura, India.印度特里普拉邦城市贫民窟五岁以下儿童营养不良的患病率及影响因素
Indian J Community Med. 2025 Jul-Aug;50(4):599-606. doi: 10.4103/ijcm.ijcm_752_23. Epub 2025 Feb 1.
3
Preliminary Effectiveness of a Postnatal mHealth and Virtual Social Support Intervention on Newborn and Infant Health and Feeding Practices in Punjab, India: Quasi-Experimental Pre-Post Pilot Study.

本文引用的文献

1
Mortality, morbidity, and risk factors in China and its provinces, 1990-2017: a systematic analysis for the Global Burden of Disease Study 2017.死亡率、发病率和风险因素在中国及其省份,1990-2017 年:2017 年全球疾病负担研究的系统分析。
Lancet. 2019 Sep 28;394(10204):1145-1158. doi: 10.1016/S0140-6736(19)30427-1. Epub 2019 Jun 24.
2
National, regional, and worldwide estimates of low birthweight in 2015, with trends from 2000: a systematic analysis.2015 年全球、区域和国家低出生体重估计值及其 2000 年以来的变化趋势:系统分析。
Lancet Glob Health. 2019 Jul;7(7):e849-e860. doi: 10.1016/S2214-109X(18)30565-5. Epub 2019 May 15.
3
印度旁遮普邦一项关于产后移动健康与虚拟社会支持干预对新生儿及婴儿健康和喂养方式的初步效果:准实验性前后对照试点研究
JMIR Pediatr Parent. 2025 Jun 27;8:e65581. doi: 10.2196/65581.
4
Forecasting acute childhood malnutrition in Kenya using machine learning and diverse sets of indicators.利用机器学习和多种指标预测肯尼亚儿童急性营养不良情况。
PLoS One. 2025 May 14;20(5):e0322959. doi: 10.1371/journal.pone.0322959. eCollection 2025.
5
Trends in socioeconomic inequality in mortality during childhood between 1993 and 2021 in India.1993年至2021年印度儿童期死亡率的社会经济不平等趋势。
BMJ Glob Health. 2025 May 2;10(5):e016386. doi: 10.1136/bmjgh-2024-016386.
6
Childhood Obesity: A Narrative Review.儿童肥胖症:一篇叙述性综述。
Cureus. 2025 Apr 14;17(4):e82233. doi: 10.7759/cureus.82233. eCollection 2025 Apr.
7
Sesame Jaggery Ball Supplementation as a Dietary Adjunct Therapy in Treating Moderate Iron Deficiency Anemia Among Children Aged 6-11 Years in South India: An Open-Labeled Randomized Controlled Trial.芝麻红糖球补充剂作为印度南部6至11岁儿童中度缺铁性贫血膳食辅助治疗的开放标签随机对照试验
Indian J Hematol Blood Transfus. 2025 Apr;41(2):267-273. doi: 10.1007/s12288-024-01880-1. Epub 2024 Sep 28.
8
Engaging males to improve nutrition outcomes in young children in Bihar.促使男性参与以改善比哈尔邦幼儿的营养状况。
Front Nutr. 2025 Mar 13;12:1453644. doi: 10.3389/fnut.2025.1453644. eCollection 2025.
9
Economic loss attributable to premature deaths and morbidity among adolescents in India and its states.印度及其各邦青少年过早死亡和发病所致的经济损失。
BMC Med. 2025 Jan 29;23(1):51. doi: 10.1186/s12916-025-03895-5.
10
Impact of Early Childhood Malnutrition on Cardiometabolic Risk Factors in Young Adults from Marginalized Areas of Chiapas, Mexico.墨西哥恰帕斯州边缘化地区幼儿营养不良对年轻成人心脏代谢危险因素的影响。
Nutrients. 2025 Jan 11;17(2):254. doi: 10.3390/nu17020254.
The impact of air pollution on deaths, disease burden, and life expectancy across the states of India: the Global Burden of Disease Study 2017.
空气污染对印度各邦居民死亡、疾病负担和预期寿命的影响:2017 年全球疾病负担研究。
Lancet Planet Health. 2019 Jan;3(1):e26-e39. doi: 10.1016/S2542-5196(18)30261-4. Epub 2018 Dec 6.
4
Measuring progress from 1990 to 2017 and projecting attainment to 2030 of the health-related Sustainable Development Goals for 195 countries and territories: a systematic analysis for the Global Burden of Disease Study 2017.衡量 1990 年至 2017 年期间的进展情况,并预测 195 个国家和地区在 2030 年实现与健康相关的可持续发展目标的情况:基于 2017 年全球疾病负担研究的系统分析。
Lancet. 2018 Nov 10;392(10159):2091-2138. doi: 10.1016/S0140-6736(18)32281-5. Epub 2018 Nov 8.
5
Population and fertility by age and sex for 195 countries and territories, 1950-2017: a systematic analysis for the Global Burden of Disease Study 2017.1950-2017 年 195 个国家和地区按年龄和性别划分的人口和生育率:2017 年全球疾病负担研究的系统分析。
Lancet. 2018 Nov 10;392(10159):1995-2051. doi: 10.1016/S0140-6736(18)32278-5. Epub 2018 Nov 8.
6
Global, regional, and national comparative risk assessment of 84 behavioural, environmental and occupational, and metabolic risks or clusters of risks for 195 countries and territories, 1990-2017: a systematic analysis for the Global Burden of Disease Study 2017.全球、区域和国家 84 种行为、环境、职业和代谢风险以及 195 个国家和地区 1990 至 2017 年风险簇的比较风险评估:全球疾病负担研究 2017 系统分析。
Lancet. 2018 Nov 10;392(10159):1923-1994. doi: 10.1016/S0140-6736(18)32225-6. Epub 2018 Nov 8.
7
Health disparities across the counties of Kenya and implications for policy makers, 1990-2016: a systematic analysis for the Global Burden of Disease Study 2016.1990 年至 2016 年肯尼亚各县的健康差距及其对政策制定者的影响:2016 年全球疾病负担研究的系统分析。
Lancet Glob Health. 2019 Jan;7(1):e81-e95. doi: 10.1016/S2214-109X(18)30472-8. Epub 2018 Oct 25.
8
Global, regional, and national disability-adjusted life-years (DALYs) for 359 diseases and injuries and healthy life expectancy (HALE) for 195 countries and territories, 1990-2017: a systematic analysis for the Global Burden of Disease Study 2017.全球、地区和国家残疾调整生命年(DALYs)359 种疾病和伤害以及 195 个国家和地区 1990-2017 年的健康期望寿命(HALE):2017 年全球疾病负担研究的系统分析。
Lancet. 2018 Nov 10;392(10159):1859-1922. doi: 10.1016/S0140-6736(18)32335-3.
9
Trends and drivers of change in the prevalence of anaemia among 1 million women and children in India, 2006 to 2016.2006年至2016年印度100万妇女和儿童贫血患病率的变化趋势及驱动因素
BMJ Glob Health. 2018 Oct 19;3(5):e001010. doi: 10.1136/bmjgh-2018-001010. eCollection 2018.
10
Understanding the geographical burden of stunting in India: A regression-decomposition analysis of district-level data from 2015-16.了解印度发育迟缓的地理负担:2015-16 年地区数据的回归分解分析。
Matern Child Nutr. 2018 Oct;14(4):e12620. doi: 10.1111/mcn.12620. Epub 2018 May 23.