Department of Ophthalmology, Counties Manukau DHB, Auckland, New Zealand.
Centre for Ophthalmology and Visual Science, The University of Western Australia, Perth, Australia.
PLoS One. 2020 May 7;15(5):e0232523. doi: 10.1371/journal.pone.0232523. eCollection 2020.
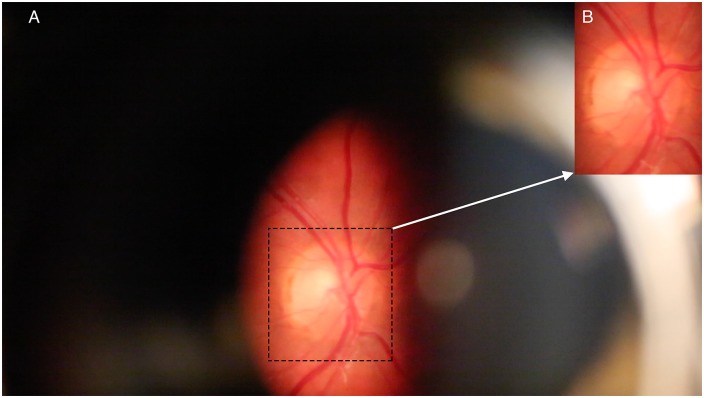
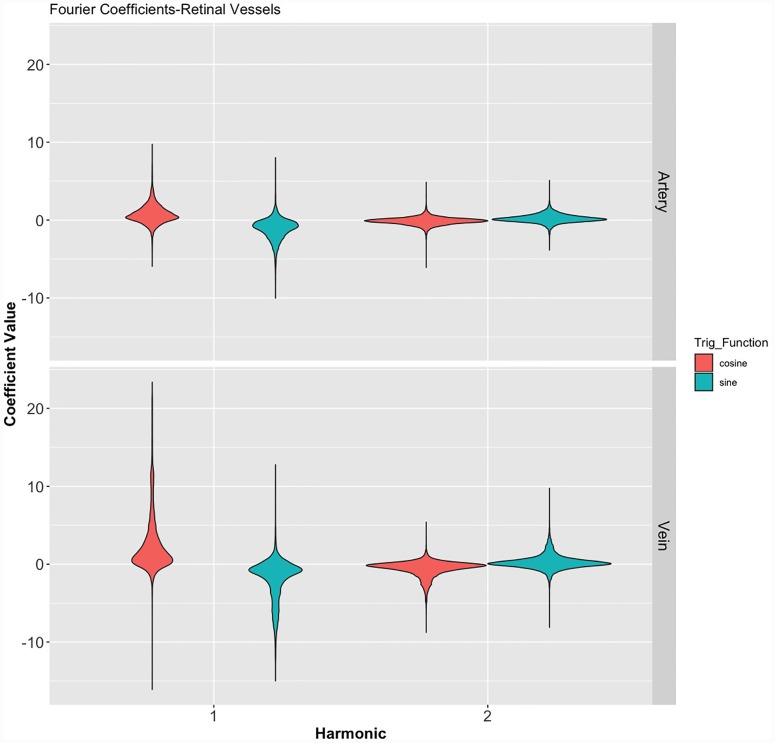
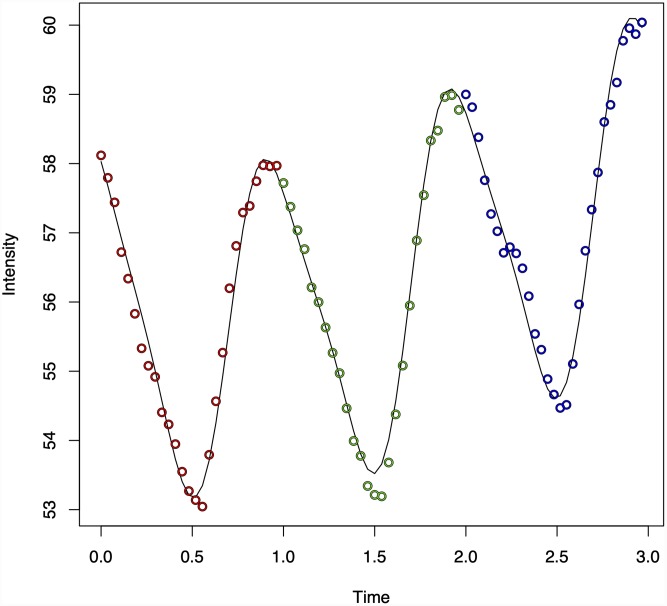
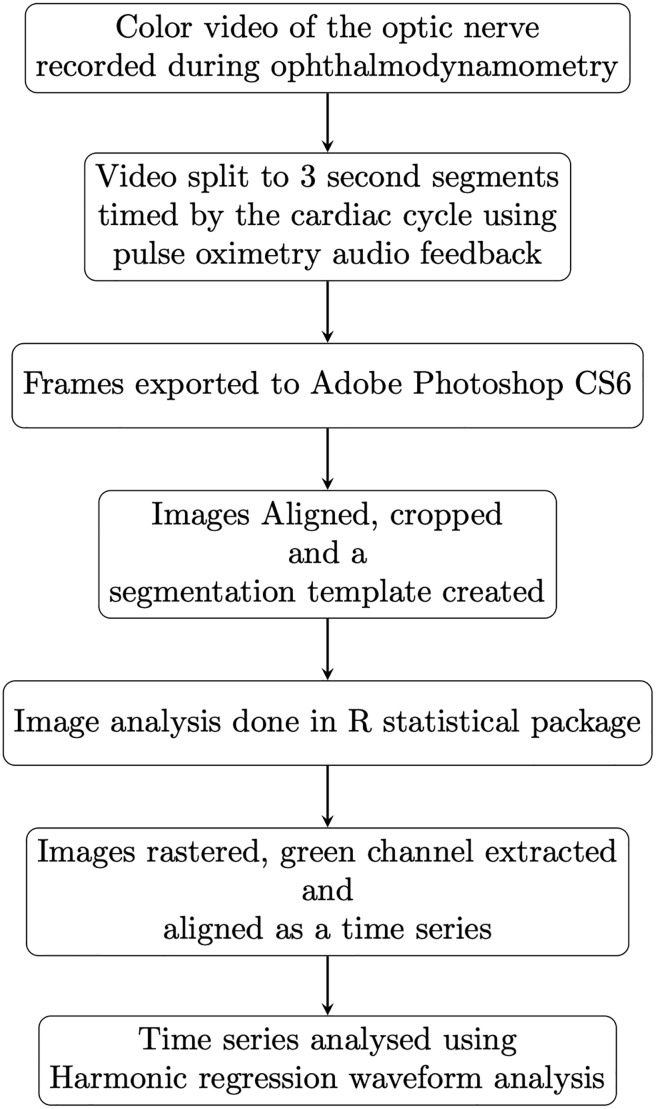
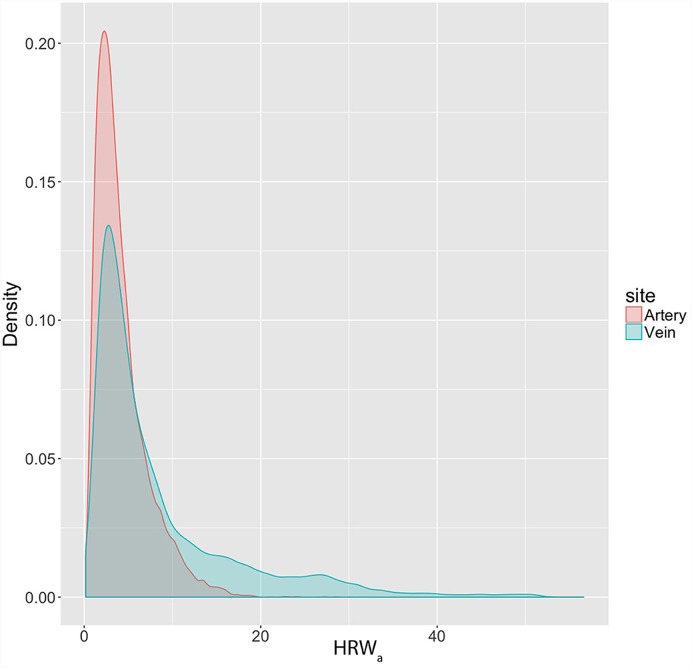
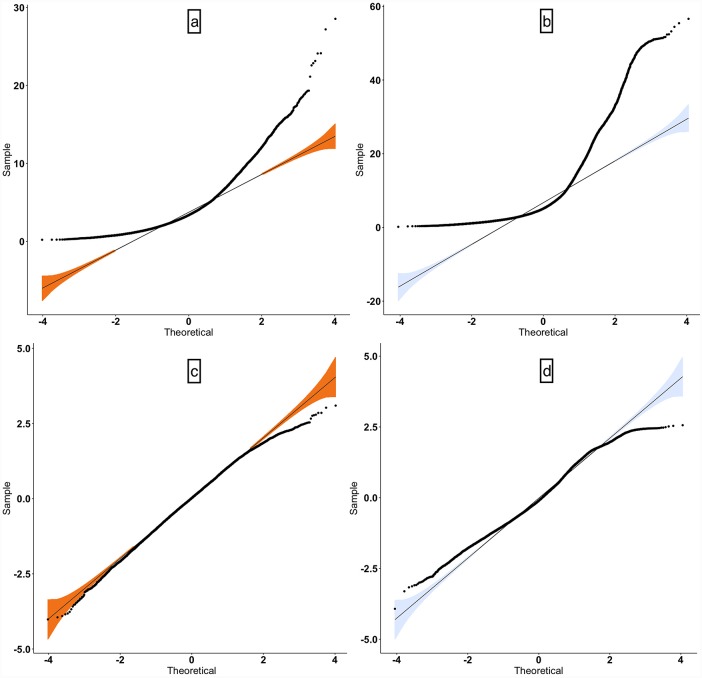
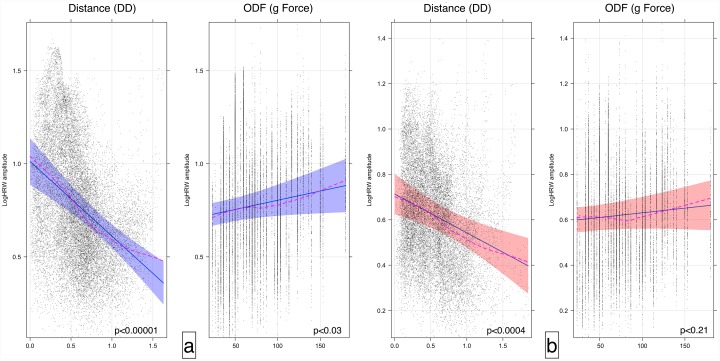
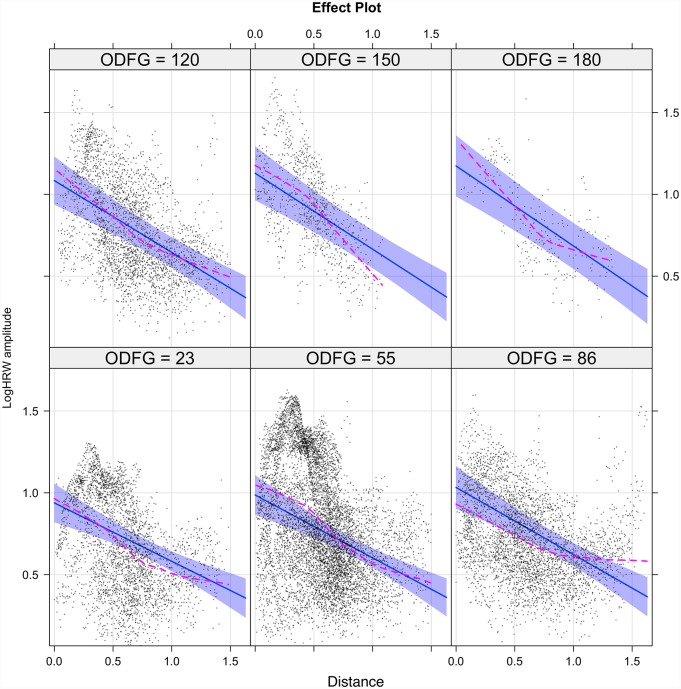
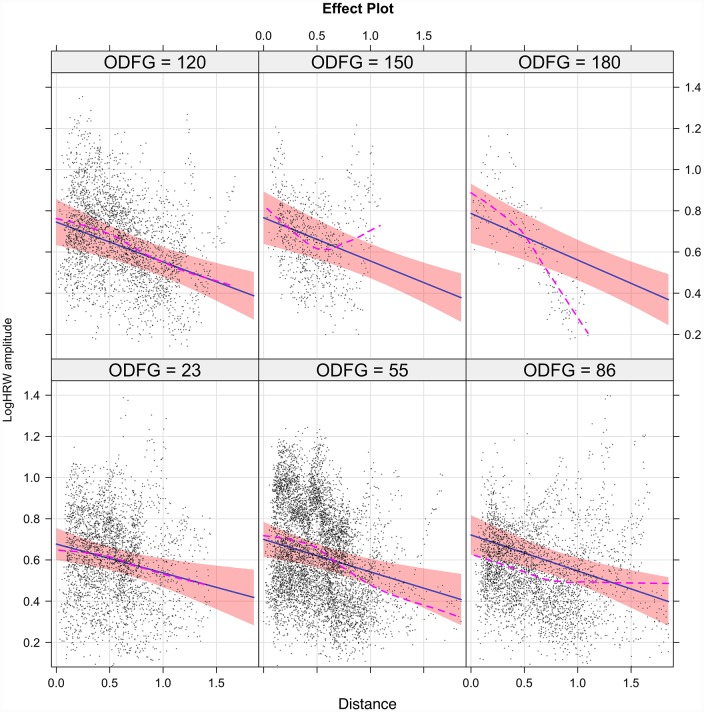
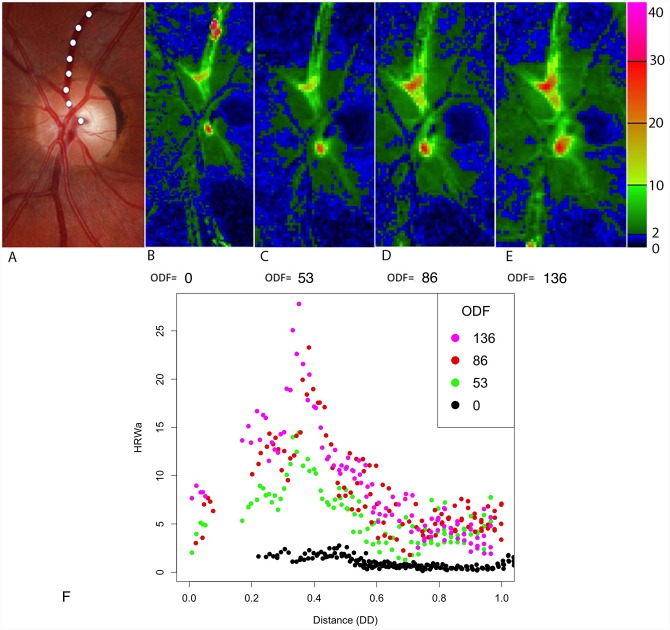
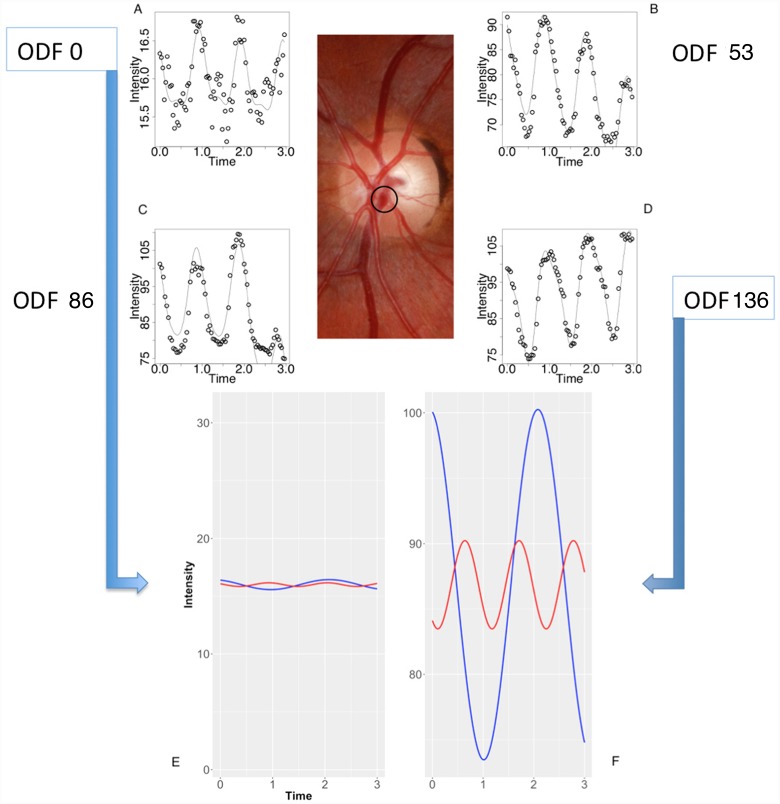
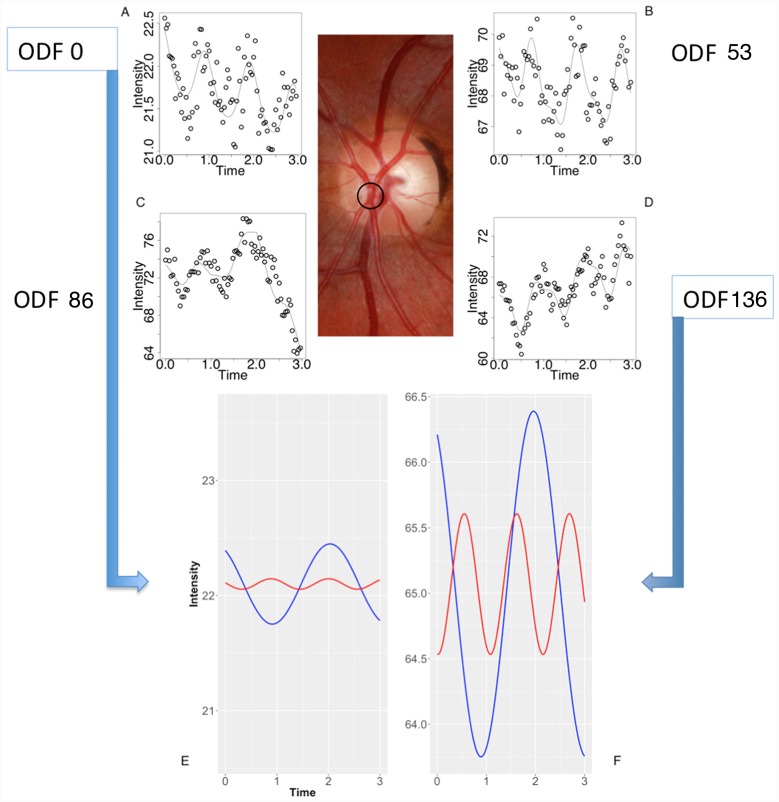
Pulse wave attenuation characteristics reflect compliance and resistance properties of the vessel wall as well as initial pulse generation factors. Recently, it has become possible to measure and map the retinal vessel wall pulse wave amplitudes. Predictable pulse wave amplitude distribution may allow inferences to be made concerning vascular compliance and resistance. Twenty-eight eyes from sixteen subjects (8 male and 8 female) were examined using modified retinal photoplethysmography with simultaneous ophthalmodynamometry. This allowed the assessment of vessel wall pulsation amplitudes under a dynamic range of intraocular pressures. Pulse amplitudes were calculated using harmonic regression analysis. The pulse wave attenuation was measured under different ranges of ophthalmodynamometric force (ODF) as a function of distance along the vessel (VDist), which in turn was calculated in disc diameters (DD) from the center of the optic disc. A linear mixed-effects model with randomized slopes and intercepts was used to estimate the correlations between the logarithmically transformed harmonic regression wave amplitude (HRWa) and the Fourier trigonometric coefficients with the predictors (VDist and ODF). The retinal venous harmonic regression wave attenuation (coefficient value±standard error) -0.40±0.065/DD, (p-value < 0.00001, 95% confidence interval (CI) -0.53 to -0.27), which was approximately twice that of the arterial -0.17±0.048/DD, (p-value < 0.0004, 95% CI = -0.27 to -0.08). There was a positive correlation between attenuation of the harmonic regression wave and ophthalmodynamometric force in both vascular systems. The attenuation of all but the sine coefficient of the second Fourier harmonic (bn2) achieved statistical significance in the correlation with VDist. The cosine coefficient of the first Fourier harmonic an1 was the only coefficient to achieve statistical significance in the correlation with the predictors VDist and ODF in both vascular systems. The an1 coefficient value in the correlation with VDist was -3.79±0.78 and -1.269±0.37 (p < 0.0006), while this coefficient value in the correlation with ODF was 0.026±0.0099 and 0.009±0.04 (p < 0.01) in both the retinal veins and arteries respectively. The predictable attenuation characteristics in normal subjects suggest that this technique may allow the non-invasive quantification of retinal vascular compliance and other hemodynamic parameters.
脉搏波衰减特征反映了血管壁的顺应性和阻力特性以及初始脉搏产生因素。最近,已经可以测量和绘制视网膜血管壁脉搏波幅度。可预测的脉搏波幅度分布可以推断血管的顺应性和阻力。使用改良的视网膜光体积描记法和同时的眼动力学测量法检查了 16 名受试者(8 名男性和 8 名女性)的 28 只眼睛。这允许在动态范围内评估眼压下的血管壁搏动幅度。使用谐波回归分析计算脉搏幅度。测量了在不同眼动力计力(ODF)范围内的脉搏波衰减作为距离(VDist)的函数,该距离反过来又以视盘中心的视盘直径(DD)计算。使用具有随机斜率和截距的线性混合效应模型来估计对数变换的谐波回归波幅度(HRWa)与预测因子(VDist 和 ODF)之间的傅立叶三角函数系数之间的相关性。视网膜静脉的谐波回归波衰减(系数值±标准误差)-0.40±0.065/DD,(p 值<0.00001,95%置信区间(CI)-0.53 至-0.27),大约是动脉的两倍-0.17±0.048/DD,(p 值<0.0004,95%CI=-0.27 至-0.08)。在两个血管系统中,谐波回归波的衰减与眼动计力之间存在正相关。除了第二个傅立叶谐波的正弦系数(bn2)之外,所有系数的衰减在与 VDist 的相关性中均达到统计学意义。在与两个血管系统的预测因子 VDist 和 ODF 的相关性中,只有第一傅立叶谐波的余弦系数 an1 达到统计学意义。在与 VDist 的相关性中,an1 系数值为-3.79±0.78 和-1.269±0.37(p<0.0006),而在与 ODF 的相关性中,该系数值在视网膜静脉和动脉中分别为 0.026±0.0099 和 0.009±0.04(p<0.01)。正常受试者中可预测的衰减特征表明,该技术可能允许无创量化视网膜血管顺应性和其他血流动力学参数。