Mayo Clinic Graduate School of Biomedical Sciences, Rochester, Minnesota, USA
Division of Health Care Policy & Research, Department of Health Sciences Research, Mayo Clinic, Rochester, Minnesota, USA.
BMJ Open. 2020 May 17;10(5):e035376. doi: 10.1136/bmjopen-2019-035376.
To identify the relationships between county-level area deprivation and patterns of both opioid prescriptions and drug-poisoning mortality.
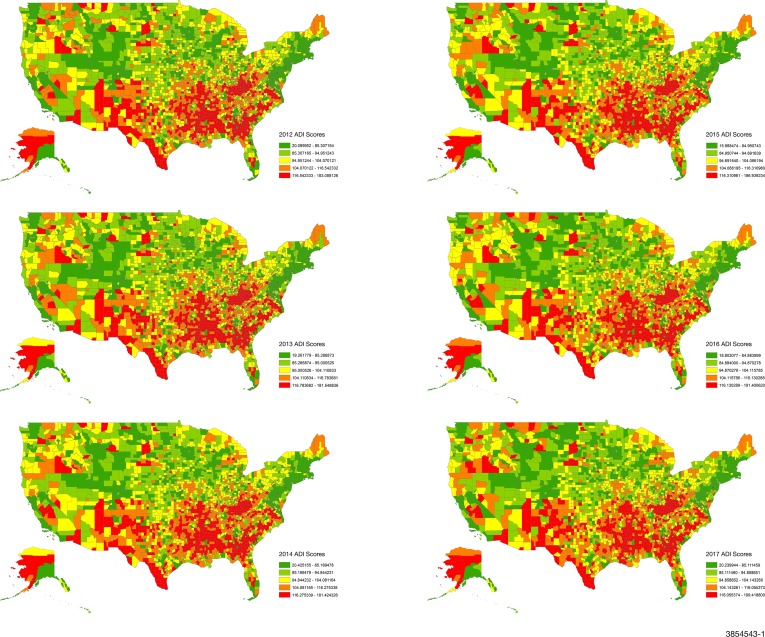
DESIGN, SETTING AND PARTICIPANTS: For this retrospective cross-sectional study, we used the IQVIA Xponent data to capture opioid prescriptions and Centres for Disease Control and Prevention National Vital Statistics System to assess drug-poisoning mortality. The Area Deprivation Index (ADI) is a composite measure of social determinants of health comprised of 17 US census indicators, spanning four socioeconomic domains. For all US counties with available opioid prescription (2712 counties) and drug-poisoning mortality (3133 counties) data between 2012 and 2017, we used negative binomial regression to examine the association between quintiles of county-level ADI and the rates of opioid prescriptions and drug-poisoning mortality adjusted for year, age, race and sex.
County-level opioid prescription fills and drug-poisoning mortality.
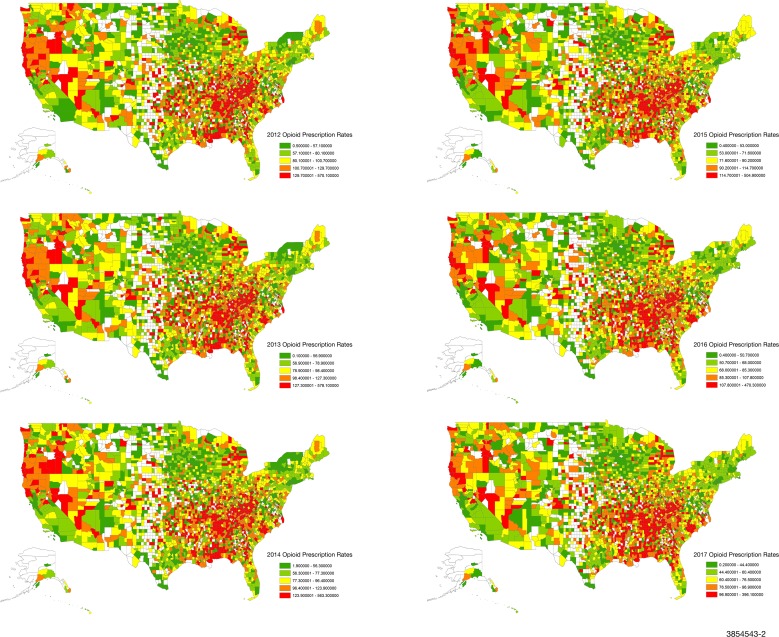
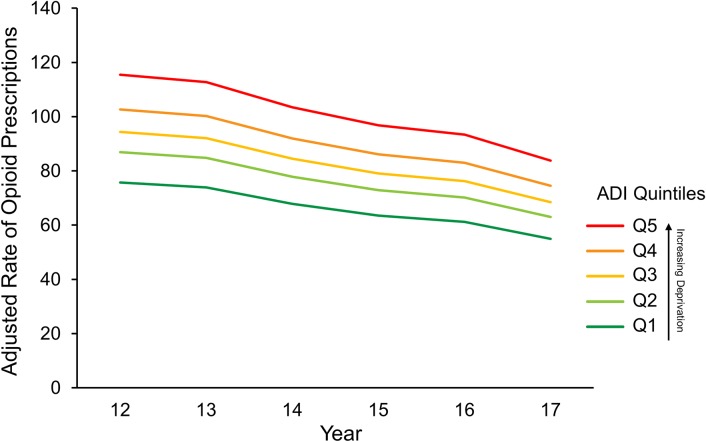
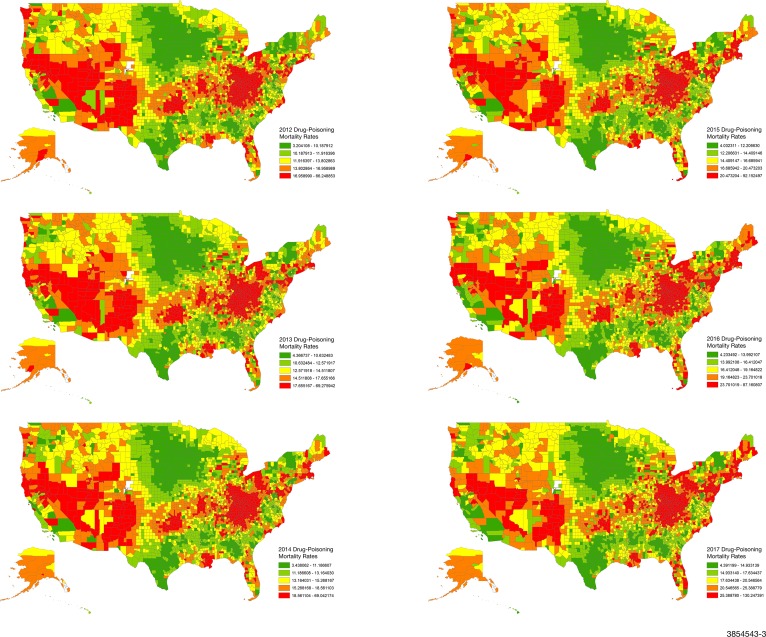
Between 2012 and 2017, overall rates of opioid prescriptions decreased from 96.6 to 72.2 per 100 people, while the rates of drug-poisoning mortality increased from 14.3 to 22.8 per 100 000 people. Opioid prescription and drug-poisoning mortality rates were consistently higher with greater levels of deprivation. The risk of filling an opioid prescription was 72% higher, and the risk of drug-poisoning mortality was 36% higher, for most deprived compared with the least deprived counties (both p<0.001).
Counties with greater area-level deprivation have higher rates of filled opioid prescriptions and drug-poisoning mortality. Although opioid prescription rates declined across all ADI quintiles, the rates of drug-poisoning mortality continued to rise proportionately in each ADI quintile. This underscores the need for individualised and targeted interventions that consider the deprivation of communities where people live.
确定县级贫困地区与阿片类药物处方和药物中毒死亡率模式之间的关系。
设计、地点和参与者:本回顾性横断面研究使用 IQVIA Xponent 数据来捕获阿片类药物处方,以及疾病控制与预防中心国家生命统计系统来评估药物中毒死亡率。区域贫困指数(ADI)是一个综合的健康决定因素指标,由 17 个美国人口普查指标组成,涵盖了四个社会经济领域。对于 2012 年至 2017 年期间有可用阿片类药物处方(2712 个县)和药物中毒死亡率(3133 个县)数据的所有美国县,我们使用负二项回归来检查县一级 ADI 五分位数与调整后年份、年龄、种族和性别的阿片类药物处方和药物中毒死亡率之间的关联。
县一级的阿片类药物处方和药物中毒死亡率。
2012 年至 2017 年间,总体阿片类药物处方率从每 100 人 96.6 下降到 72.2,而药物中毒死亡率从每 100000 人 14.3 上升到 22.8。贫困程度越高,阿片类药物处方和药物中毒死亡率的比例越高。与最不贫困的县相比,最贫困的县开出阿片类药物处方的风险高 72%,药物中毒死亡率的风险高 36%(两者均<0.001)。
贫困程度较高的县开出的阿片类药物处方和药物中毒死亡率较高。尽管所有 ADI 五分位数的阿片类药物处方率都有所下降,但在每个 ADI 五分位数中,药物中毒死亡率仍继续按比例上升。这突显出需要采取个性化和有针对性的干预措施,考虑到人们居住的社区的贫困程度。