Deruelle Tristan, Kober Frank, Perles-Barbacaru Adriana, Delzescaux Thierry, Noblet Vincent, Barbier Emmanuel L, Dojat Michel
INSERM, U1216, Grenoble Institut des Neurosciences, Université Grenoble Alpes, Grenoble, France.
CNRS, CRMBM, Aix-Marseille Université, Marseille, France.
Front Neuroinform. 2020 May 19;14:22. doi: 10.3389/fninf.2020.00022. eCollection 2020.
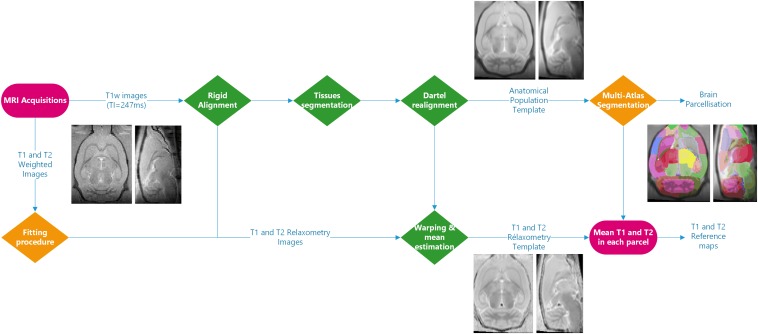
Similarly to human population imaging, there are several well-founded motivations for animal population imaging, the most notable being the improvement of the validity of statistical results by pooling a sufficient number of animal data provided by different imaging centers. In this paper, we demonstrate the feasibility of such a multicenter animal study, sharing raw data from forty rats and processing pipelines between four imaging centers. As specific use case, we focused on T1 and T2 mapping of the healthy rat brain at 7T. We quantitatively report about the variability observed across two MR data providers and evaluate the influence of image processing steps on the final maps, using three fitting algorithms from three centers. Finally, to derive relaxation times from different brain areas, two multi-atlas segmentation pipelines from different centers were performed on two different platforms. Differences between the two data providers were 2.21% for T1 and 9.52% for T2. Differences between processing pipelines were 1.04% for T1 and 3.33% for T2. These maps, obtained in healthy conditions, may be used in the future as reference when exploring alterations in animal models of pathology.
与人类群体成像类似,动物群体成像也有几个充分的动机,其中最显著的是通过汇集不同成像中心提供的足够数量的动物数据来提高统计结果的有效性。在本文中,我们展示了这样一项多中心动物研究的可行性,分享了来自40只大鼠的原始数据以及四个成像中心之间的处理流程。作为具体的用例,我们专注于在7T磁场下对健康大鼠大脑进行T1和T2映射。我们定量报告了在两个磁共振数据提供者之间观察到的变异性,并使用来自三个中心的三种拟合算法评估图像处理步骤对最终图谱的影响。最后,为了从不同脑区得出弛豫时间,在两个不同平台上对来自不同中心的两个多图谱分割流程进行了操作。两个数据提供者之间T1的差异为2.21%,T2的差异为9.52%。处理流程之间T1的差异为1.04%,T2的差异为3.33%。这些在健康条件下获得的图谱,未来在探索病理动物模型的变化时可作为参考。