IZBI, Interdisciplinary Centre for Bioinformatics, Universität Leipzig, Härtelstr. 16-18, 04107 Leipzig, Germany.
Viruses. 2020 Jul 20;12(7):777. doi: 10.3390/v12070777.
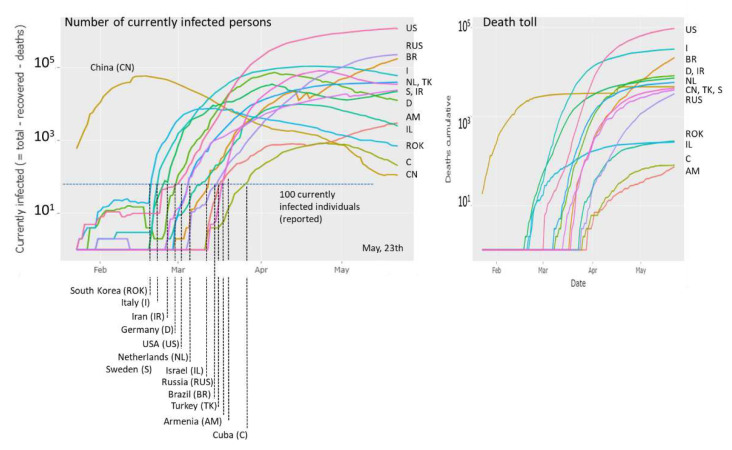
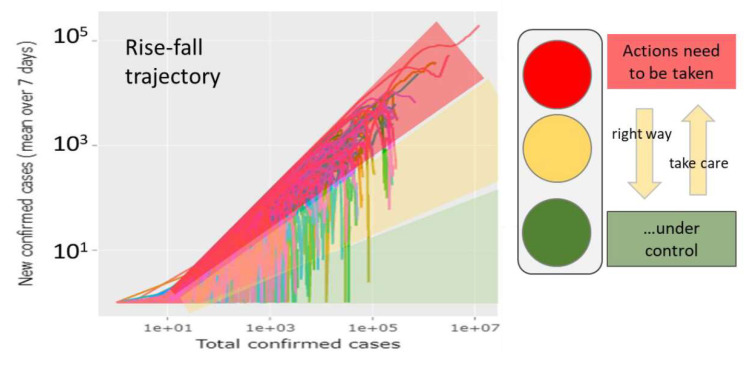
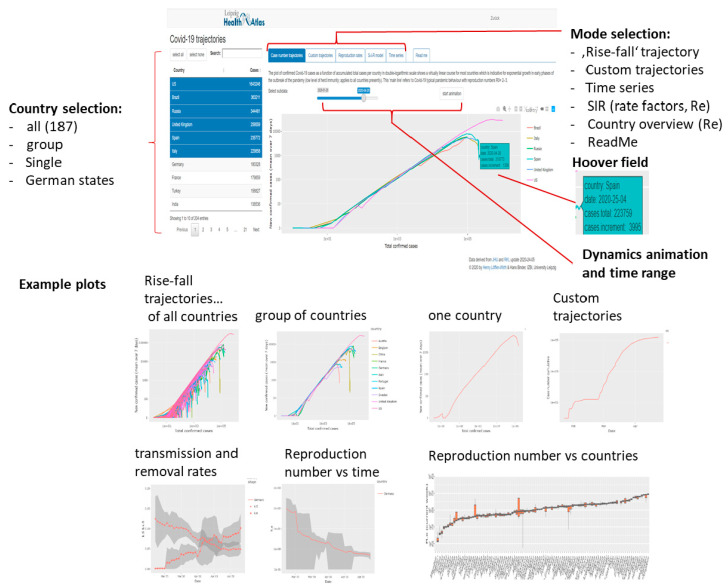
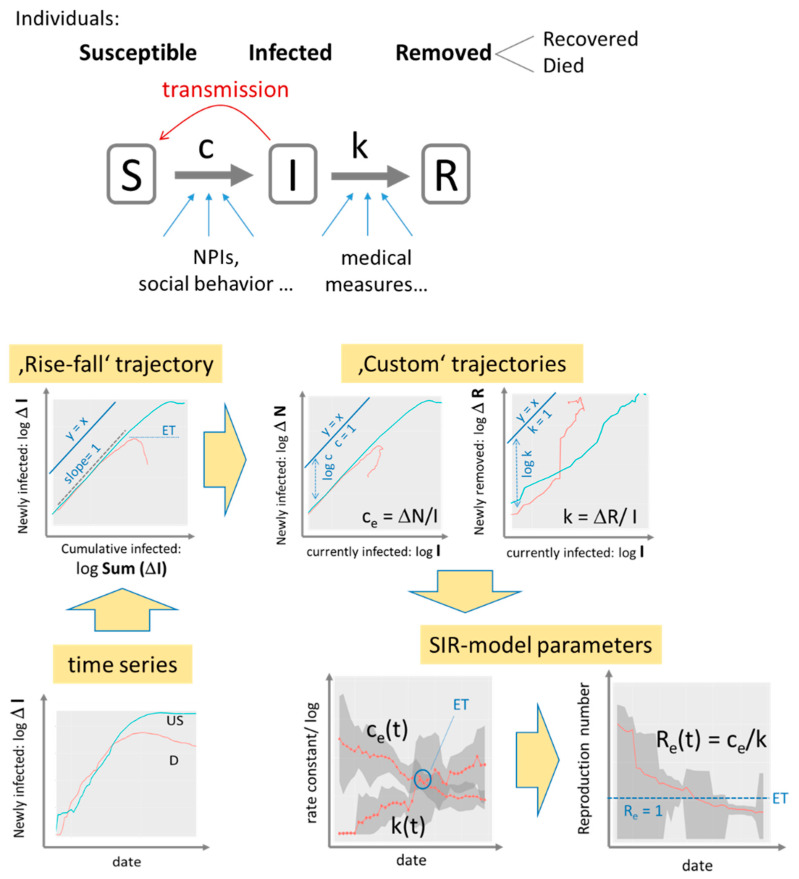
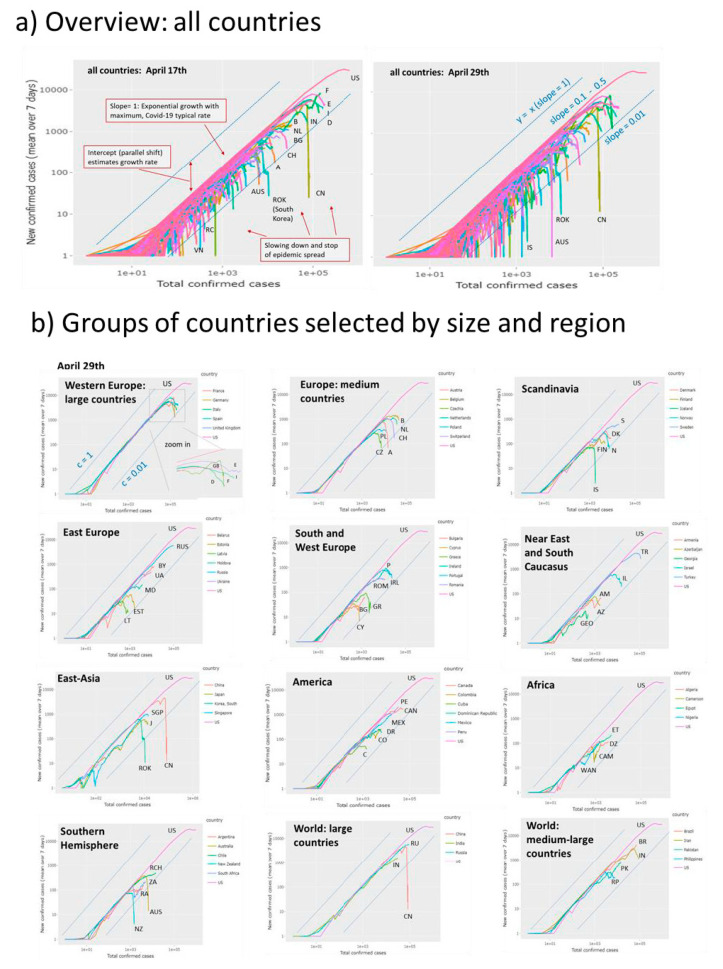
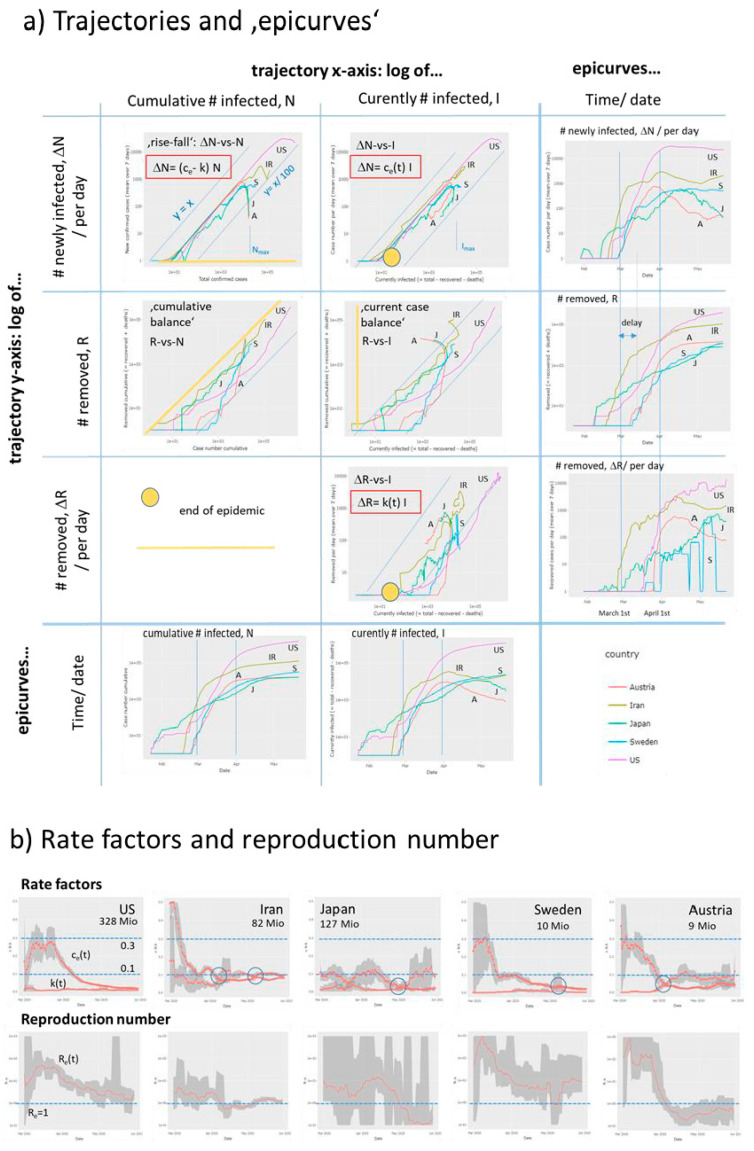
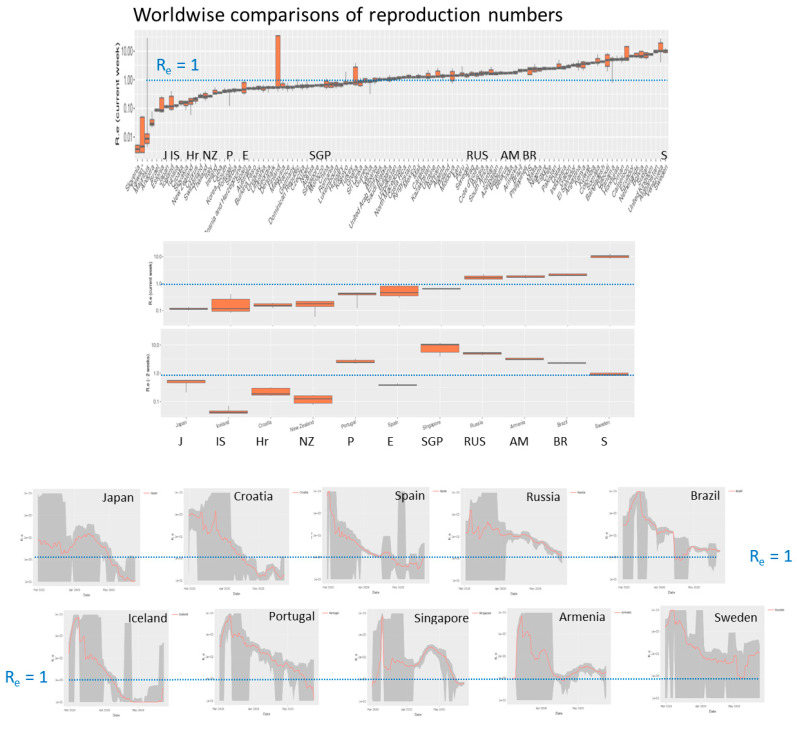
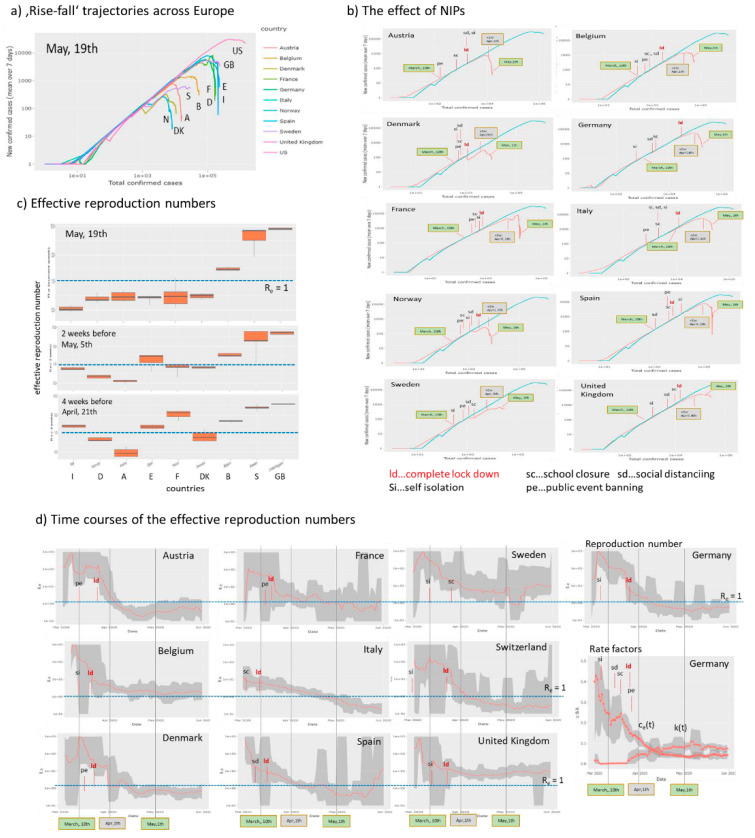
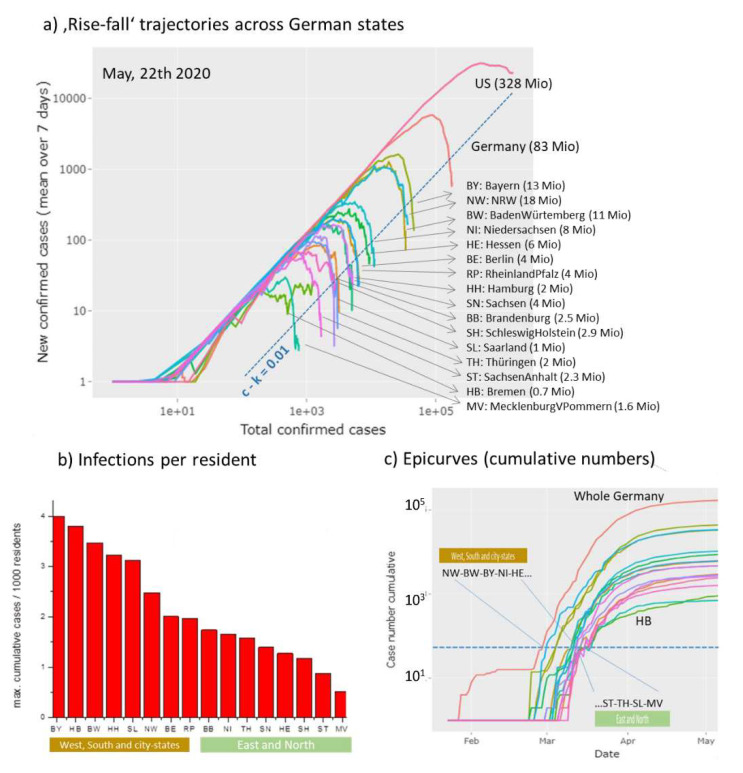
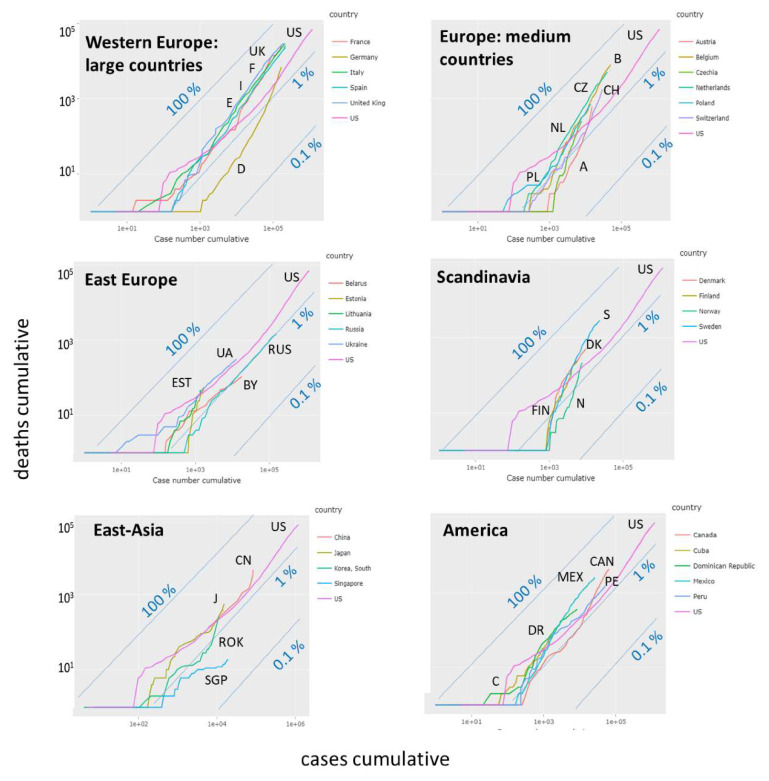
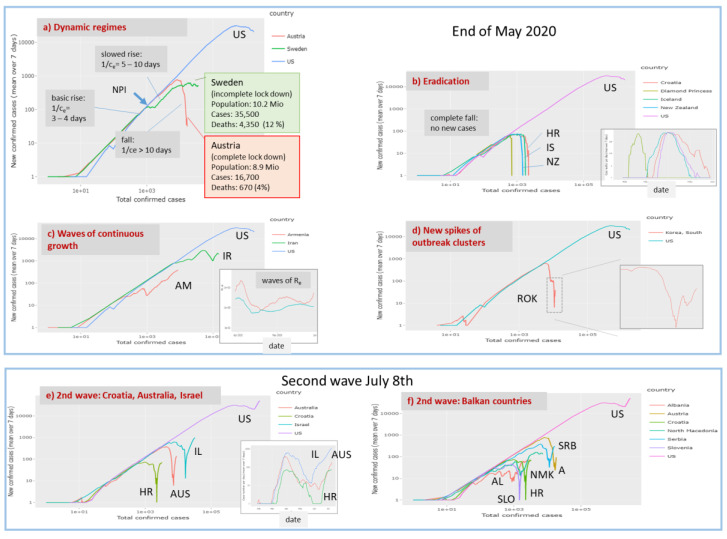
The Covid-19 pandemic is developing worldwide with common dynamics but also with marked differences between regions and countries. These are not completely understood, but presumably, provide a clue to find ways to mitigate epidemics until strategies leading to its eradication become available. We describe an iteractive monitoring tool available in the internet. It enables inspection of the dynamic state of the epidemic in 187 countries using trajectories that visualize the transmission and removal rates of the epidemic and in this way bridge epi-curve tracking with modelling approaches. Examples were provided which characterize state of epidemic in different regions of the world in terms of fast and slow growing and decaying regimes and estimate associated rate factors. The basic spread of the disease is associated with transmission between two individuals every two-three days on the average. Non-pharmaceutical interventions decrease this value to up to ten days, whereas 'complete lock down' measures are required to stop the epidemic. Comparison of trajectories revealed marked differences between the countries regarding efficiency of measures taken against the epidemic. Trajectories also reveal marked country-specific recovery and death rate dynamics. The results presented refer to the pandemic state in May to July 2020 and can serve as 'working instruction' for timely monitoring using the interactive monitoring tool as a sort of 'seismometer' for the evaluation of the state of epidemic, e.g., the possible effect of measures taken in both, lock-down and lock-up directions. Comparison of trajectories between countries and regions will support developing hypotheses and models to better understand regional differences of dynamics of Covid-19.
新冠疫情在全球范围内发展,具有共同的动态特征,但各地区和国家之间也存在明显差异。这些差异尚未被完全理解,但推测它们提供了一种线索,可以找到减轻疫情的方法,直到可以采用导致其消除的策略。我们描述了一种可在互联网上使用的交互式监测工具。它使用可视化疫情传播和消除率的轨迹,能够检查 187 个国家的疫情动态状态,从而将疫情追踪与建模方法联系起来。提供了一些示例,这些示例以快速和慢速增长和衰减阶段为特征,描述了世界不同地区的疫情状况,并估计了相关的速率因素。疾病的基本传播与平均每两到三天传播给两个人有关。非药物干预措施将此值降低到最多十天,而要阻止疫情则需要采取“完全封锁”措施。轨迹的比较揭示了各国在疫情防控措施效率方面的显著差异。轨迹还揭示了特定国家特有的恢复和死亡率动态。所呈现的结果涉及 2020 年 5 月至 7 月的大流行状态,并可作为使用交互式监测工具进行及时监测的“工作说明”,例如,评估疫情状况的措施(例如,封锁和锁定方向的措施)可能产生的影响。国家和地区之间的轨迹比较将支持提出假设和模型,以更好地理解新冠疫情动态的区域差异。