Peirlinck Mathias, Linka Kevin, Costabal Francisco Sahli, Bhattacharya Jay, Bendavid Eran, Ioannidis John P A, Kuhl Ellen
Department of Mechanical Engineering, Stanford University School of Engineering, Stanford, California, United States.
Department of Mechanical and Metallurgical Engineering and Institute for Biological and Medical Engineering, Schools of Engineering, Biology and Medicine, Pontificia Universidad Catolica de Chile, Santiago, Chile.
medRxiv. 2020 Aug 29:2020.05.23.20111419. doi: 10.1101/2020.05.23.20111419.
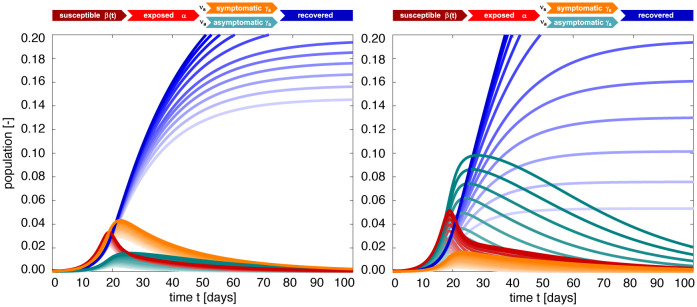
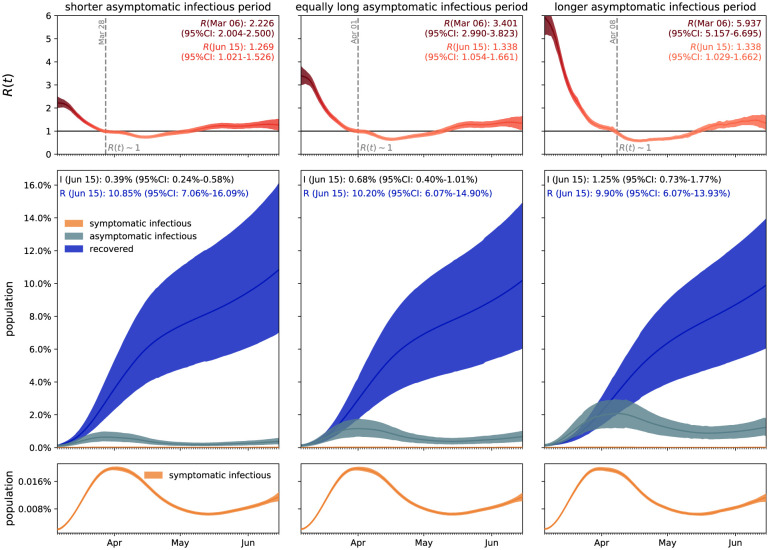
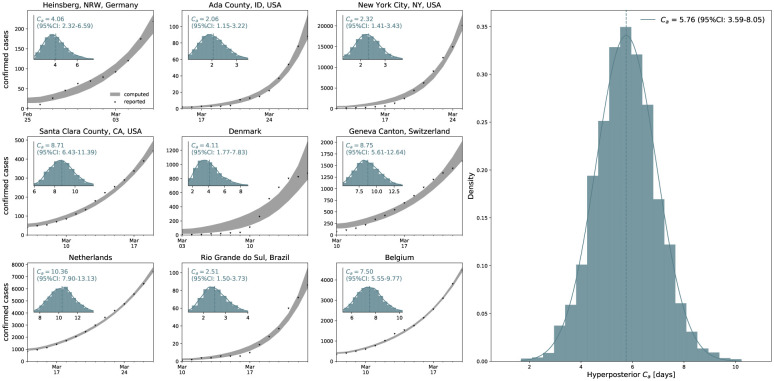
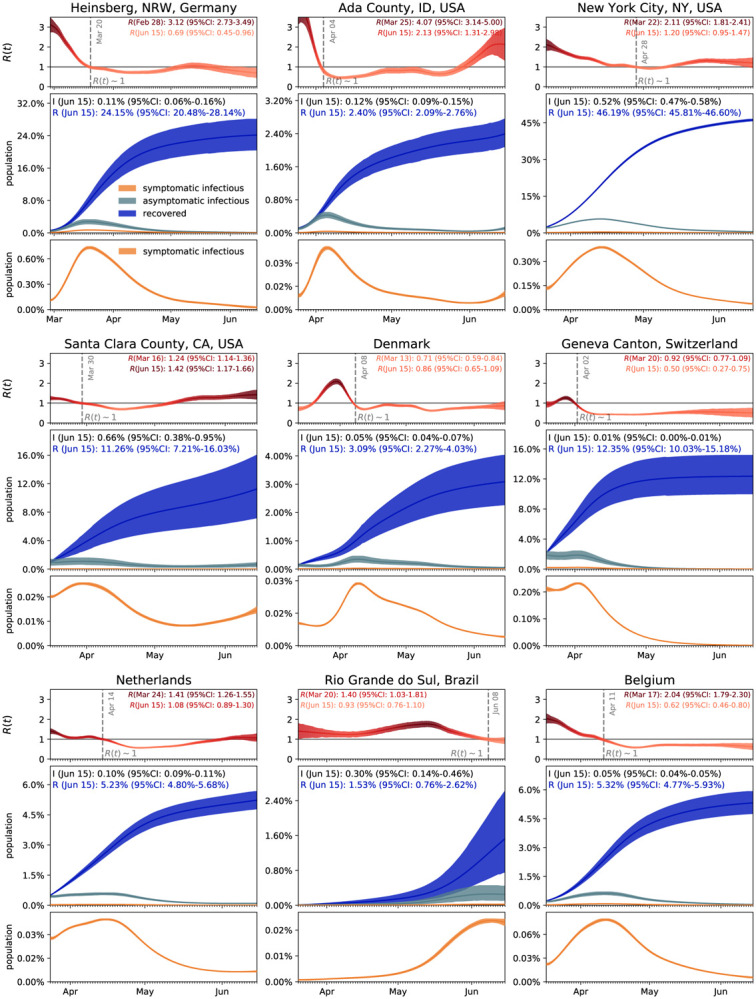
Understanding the outbreak dynamics of the COVID-19 pandemic has important implications for successful containment and mitigation strategies. Recent studies suggest that the population prevalence of SARS-CoV-2 antibodies, a proxy for the number of asymptomatic cases, could be an order of magnitude larger than expected from the number of reported symptomatic cases. Knowing the precise prevalence and contagiousness of asymptomatic transmission is critical to estimate the overall dimension and pandemic potential of COVID-19. However, at this stage, the effect of the asymptomatic population, its size, and its outbreak dynamics remain largely unknown. Here we use reported symptomatic case data in conjunction with antibody seroprevalence studies, a mathematical epidemiology model, and a Bayesian framework to infer the epidemiological characteristics of COVID-19. Our model computes, in real time, the time-varying contact rate of the outbreak, and projects the temporal evolution and credible intervals of the effective reproduction number and the symptomatic, asymptomatic, and recovered populations. Our study quantifies the sensitivity of the outbreak dynamics of COVID-19 to three parameters: the effective reproduction number, the ratio between the symptomatic and asymptomatic populations, and the infectious periods of both groups For nine distinct locations, our model estimates the fraction of the population that has been infected and recovered by Jun 15, 2020 to 24.15% (95% CI: 20.48%-28.14%) for Heinsberg (NRW, Germany), 2.40% (95% CI: 2.09%-2.76%) for Ada County (ID, USA), 46.19% (95% CI: 45.81%-46.60%) for New York City (NY, USA), 11.26% (95% CI: 7.21%-16.03%) for Santa Clara County (CA, USA), 3.09% (95% CI: 2.27%-4.03%) for Denmark, 12.35% (95% CI: 10.03%-15.18%) for Geneva Canton (Switzerland), 5.24% (95% CI: 4.84%-5.70%) for the Netherlands, 1.53% (95% CI: 0.76%-2.62%) for Rio Grande do Sul (Brazil), and 5.32% (95% CI: 4.77%-5.93%) for Belgium. Our method traces the initial outbreak date in Santa Clara County back to January 20, 2020 (95% CI: December 29, 2019 - February 13, 2020). Our results could significantly change our understanding and management of the COVID-19 pandemic: A large asymptomatic population will make isolation, containment, and tracing of individual cases challenging. Instead, managing community transmission through increasing population awareness, promoting physical distancing, and encouraging behavioral changes could become more relevant.
了解新冠疫情的暴发动态对于成功的防控和缓解策略具有重要意义。近期研究表明,SARS-CoV-2抗体在人群中的流行率(可作为无症状病例数量的一个指标)可能比报告的有症状病例数量所预期的要高出一个数量级。了解无症状传播的确切流行率和传染性对于评估新冠疫情的总体规模和大流行潜力至关重要。然而,在现阶段,无症状人群的影响、其规模及其暴发动态在很大程度上仍不为人知。在此,我们结合报告的有症状病例数据、抗体血清流行率研究、数学流行病学模型和贝叶斯框架来推断新冠疫情的流行病学特征。我们的模型实时计算疫情随时间变化的接触率,并预测有效再生数以及有症状、无症状和康复人群的时间演变和可信区间。我们的研究量化了新冠疫情暴发动态对三个参数的敏感性:有效再生数、有症状和无症状人群之间的比例以及两组人群的传染期。对于九个不同地点,我们的模型估计,截至2020年6月15日,德国北莱茵-威斯特法伦州海因斯贝格已感染并康复的人口比例为24.15%(95%置信区间:20.48%-28.14%),美国爱达荷州阿达县为2.40%(95%置信区间:2.09%-2.76%),美国纽约市为46.19%(95%置信区间:45.81%-46.60%),美国加利福尼亚州圣克拉拉县为11.26%(95%置信区间:7.21%-16.03%),丹麦为3.09%(95%置信区间:2.27%-4.03%),瑞士日内瓦州为12.35%(95%置信区间:10.03%-15.18%),荷兰为5.24%(95%置信区间:4.84%-5.70%),巴西南里奥格兰德州为1.53%(95%置信区间:0.76%-2.62%),比利时为5.32%(95%置信区间:4.77%-5.93%)。我们的方法将圣克拉拉县的初始疫情日期追溯到2020年1月20日(95%置信区间:2019年12月29日 - 2020年2月13日)。我们的结果可能会显著改变我们对新冠疫情的理解和管理:大量无症状人群将使对个别病例的隔离、防控和追踪变得具有挑战性。相反,通过提高公众意识、促进物理距离和鼓励行为改变来管理社区传播可能会变得更加重要。