• 文献检索
  • 文档翻译
  • 深度研究
  • 学术资讯
  • Suppr Zotero 插件Zotero 插件
  • 邀请有礼
  • 套餐&价格
  • 历史记录
应用&插件
Suppr Zotero 插件Zotero 插件浏览器插件Mac 客户端Windows 客户端微信小程序
定价
高级版会员购买积分包购买API积分包
服务
文献检索文档翻译深度研究API 文档MCP 服务
关于我们
关于 Suppr公司介绍联系我们用户协议隐私条款
关注我们

Suppr 超能文献

核心技术专利:CN118964589B侵权必究
粤ICP备2023148730 号-1Suppr @ 2026

文献检索

告别复杂PubMed语法,用中文像聊天一样搜索,搜遍4000万医学文献。AI智能推荐,让科研检索更轻松。

立即免费搜索

文件翻译

保留排版,准确专业,支持PDF/Word/PPT等文件格式,支持 12+语言互译。

免费翻译文档

深度研究

AI帮你快速写综述,25分钟生成高质量综述,智能提取关键信息,辅助科研写作。

立即免费体验

基于秩的标记选择方法用于高通量 scRNA-seq 数据。

A rank-based marker selection method for high throughput scRNA-seq data.

机构信息

Department of Mathematics, University of Michigan, 530 Church Street, Ann Arbor, 48109, USA.

Department of Mathematics, Yale University, 10 Hillhouse Ave, New Haven, 06511, USA.

出版信息

BMC Bioinformatics. 2020 Oct 23;21(1):477. doi: 10.1186/s12859-020-03641-z.

DOI:10.1186/s12859-020-03641-z
PMID:33097004
原文链接:https://pmc.ncbi.nlm.nih.gov/articles/PMC7585212/
Abstract

BACKGROUND

High throughput microfluidic protocols in single cell RNA sequencing (scRNA-seq) collect mRNA counts from up to one million individual cells in a single experiment; this enables high resolution studies of rare cell types and cell development pathways. Determining small sets of genetic markers that can identify specific cell populations is thus one of the major objectives of computational analysis of mRNA counts data. Many tools have been developed for marker selection on single cell data; most of them, however, are based on complex statistical models and handle the multi-class case in an ad-hoc manner.

RESULTS

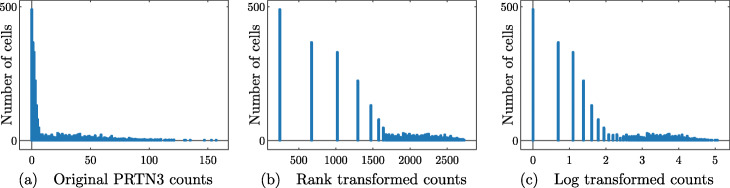
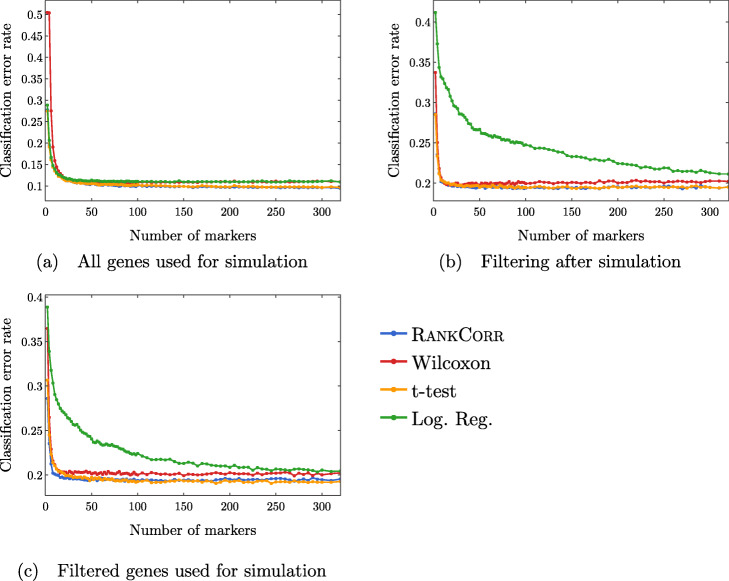
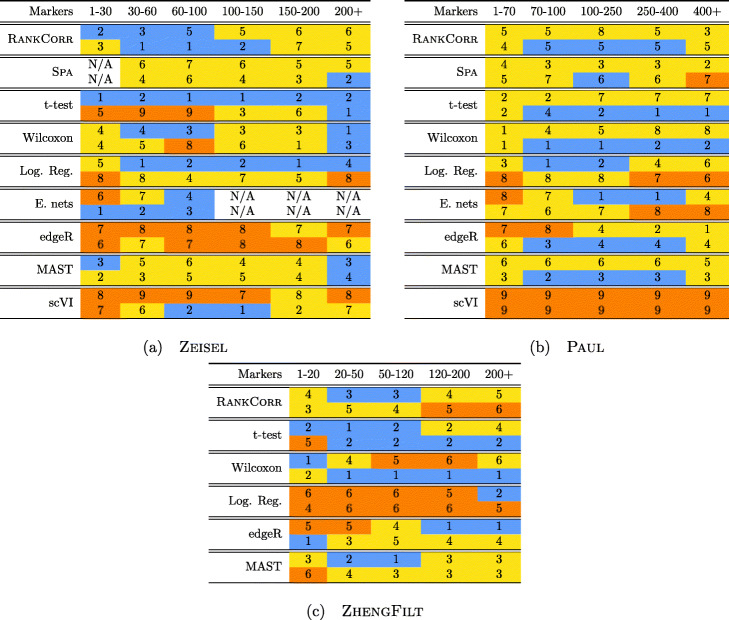
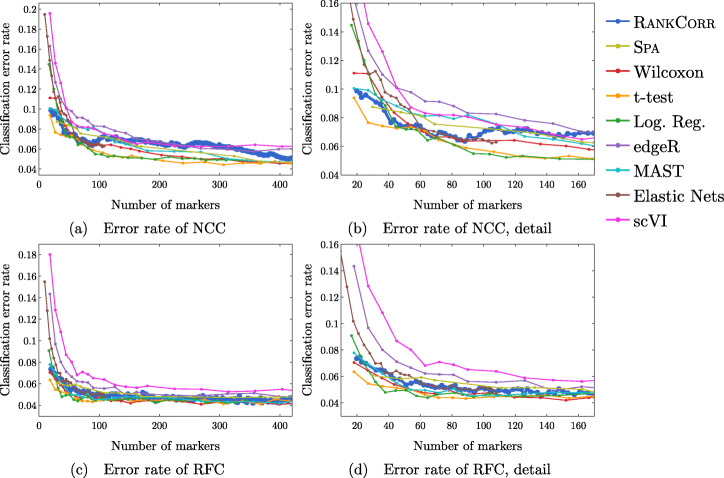
We introduce RANKCORR, a fast method with strong mathematical underpinnings that performs multi-class marker selection in an informed manner. RANKCORR proceeds by ranking the mRNA counts data before linearly separating the ranked data using a small number of genes. The step of ranking is intuitively natural for scRNA-seq data and provides a non-parametric method for analyzing count data. In addition, we present several performance measures for evaluating the quality of a set of markers when there is no known ground truth. Using these metrics, we compare the performance of RANKCORR to a variety of other marker selection methods on an assortment of experimental and synthetic data sets that range in size from several thousand to one million cells.

CONCLUSIONS

According to the metrics introduced in this work, RANKCORR is consistently one of most optimal marker selection methods on scRNA-seq data. Most methods show similar overall performance, however; thus, the speed of the algorithm is the most important consideration for large data sets (and comparing the markers selected by several methods can be fruitful). RANKCORR is fast enough to easily handle the largest data sets and, as such, it is a useful tool to add into computational pipelines when dealing with high throughput scRNA-seq data. RANKCORR software is available for download at https://github.com/ahsv/RankCorr with extensive documentation.

摘要

背景

高通量微流控方案在单细胞 RNA 测序(scRNA-seq)中,在单个实验中收集多达一百万个别细胞的 mRNA 计数;这使得对稀有细胞类型和细胞发育途径进行高分辨率研究成为可能。因此,确定可以识别特定细胞群体的小遗传标记集是 scRNA-seq 数据的计算分析的主要目标之一。已经开发了许多用于单细胞数据标记选择的工具;然而,其中大多数都是基于复杂的统计模型,并以特定的方式处理多类情况。

结果

我们引入了 RANKCORR,这是一种快速的方法,具有强大的数学基础,可以以明智的方式进行多类标记选择。RANKCORR 通过对 mRNA 计数数据进行排序,然后使用少量基因对排序后的数据进行线性分离来进行操作。排序步骤对于 scRNA-seq 数据来说是直观自然的,并且为分析计数数据提供了一种非参数方法。此外,我们提出了几种性能指标,用于在没有已知真实情况的情况下评估一组标记的质量。使用这些指标,我们在各种大小从几千到一百万细胞的实验和合成数据集上比较了 RANKCORR 与其他各种标记选择方法的性能。

结论

根据本工作中引入的指标,RANKCORR 在 scRNA-seq 数据上始终是最优化的标记选择方法之一。然而,大多数方法的整体性能相似;因此,对于大型数据集来说,算法的速度是最重要的考虑因素(比较几种方法选择的标记可能会很有成果)。RANKCORR 足够快,可以轻松处理最大的数据集,因此在处理高通量 scRNA-seq 数据时,它是计算管道中有用的工具。RANKCORR 软件可在 https://github.com/ahsv/RankCorr 下载,附带详细文档。

https://cdn.ncbi.nlm.nih.gov/pmc/blobs/fbfe/7585212/95dbd7622e92/12859_2020_3641_Fig14_HTML.jpg
https://cdn.ncbi.nlm.nih.gov/pmc/blobs/fbfe/7585212/172606f5f88a/12859_2020_3641_Fig1_HTML.jpg
https://cdn.ncbi.nlm.nih.gov/pmc/blobs/fbfe/7585212/b29e5a91f0d0/12859_2020_3641_Fig2_HTML.jpg
https://cdn.ncbi.nlm.nih.gov/pmc/blobs/fbfe/7585212/912392f012db/12859_2020_3641_Fig3_HTML.jpg
https://cdn.ncbi.nlm.nih.gov/pmc/blobs/fbfe/7585212/4dbdfab061f2/12859_2020_3641_Fig4_HTML.jpg
https://cdn.ncbi.nlm.nih.gov/pmc/blobs/fbfe/7585212/d90ad28a833b/12859_2020_3641_Fig5_HTML.jpg
https://cdn.ncbi.nlm.nih.gov/pmc/blobs/fbfe/7585212/f90fe5af1ef2/12859_2020_3641_Fig6_HTML.jpg
https://cdn.ncbi.nlm.nih.gov/pmc/blobs/fbfe/7585212/89779596aa0d/12859_2020_3641_Fig7_HTML.jpg
https://cdn.ncbi.nlm.nih.gov/pmc/blobs/fbfe/7585212/14e1d24e84cf/12859_2020_3641_Fig8_HTML.jpg
https://cdn.ncbi.nlm.nih.gov/pmc/blobs/fbfe/7585212/0218b3eb8cf3/12859_2020_3641_Fig9_HTML.jpg
https://cdn.ncbi.nlm.nih.gov/pmc/blobs/fbfe/7585212/9ebb65d39938/12859_2020_3641_Fig10_HTML.jpg
https://cdn.ncbi.nlm.nih.gov/pmc/blobs/fbfe/7585212/aceb4510da60/12859_2020_3641_Fig11_HTML.jpg
https://cdn.ncbi.nlm.nih.gov/pmc/blobs/fbfe/7585212/f09e6a5e62a3/12859_2020_3641_Fig12_HTML.jpg
https://cdn.ncbi.nlm.nih.gov/pmc/blobs/fbfe/7585212/fc5b04422449/12859_2020_3641_Fig13_HTML.jpg
https://cdn.ncbi.nlm.nih.gov/pmc/blobs/fbfe/7585212/95dbd7622e92/12859_2020_3641_Fig14_HTML.jpg

相似文献

1
A rank-based marker selection method for high throughput scRNA-seq data.基于秩的标记选择方法用于高通量 scRNA-seq 数据。
BMC Bioinformatics. 2020 Oct 23;21(1):477. doi: 10.1186/s12859-020-03641-z.
2
A multitask clustering approach for single-cell RNA-seq analysis in Recessive Dystrophic Epidermolysis Bullosa.一种用于隐性营养不良型大疱性表皮松解症的单细胞 RNA-seq 分析的多任务聚类方法。
PLoS Comput Biol. 2018 Apr 9;14(4):e1006053. doi: 10.1371/journal.pcbi.1006053. eCollection 2018 Apr.
3
A component overlapping attribute clustering (COAC) algorithm for single-cell RNA sequencing data analysis and potential pathobiological implications.单细胞 RNA 测序数据分析的一种成分重叠属性聚类(COAC)算法及其潜在的病理生物学意义。
PLoS Comput Biol. 2019 Feb 19;15(2):e1006772. doi: 10.1371/journal.pcbi.1006772. eCollection 2019 Feb.
4
Polled Digital Cell Sorter (p-DCS): Automatic identification of hematological cell types from single cell RNA-sequencing clusters.流式数字细胞分选仪(p-DCS):从单细胞 RNA 测序簇中自动识别血细胞类型。
BMC Bioinformatics. 2019 Jul 1;20(1):369. doi: 10.1186/s12859-019-2951-x.
5
Single-Cell RNA Sequencing Analysis: A Step-by-Step Overview.单细胞 RNA 测序分析:分步概述。
Methods Mol Biol. 2021;2284:343-365. doi: 10.1007/978-1-0716-1307-8_19.
6
scNPF: an integrative framework assisted by network propagation and network fusion for preprocessing of single-cell RNA-seq data.scNPF:一种基于网络传播和网络融合的综合框架,用于单细胞 RNA-seq 数据的预处理。
BMC Genomics. 2019 May 8;20(1):347. doi: 10.1186/s12864-019-5747-5.
7
scMAGS: Marker gene selection from scRNA-seq data for spatial transcriptomics studies.scMAGS:从单细胞RNA测序数据中选择标记基因用于空间转录组学研究。
Comput Biol Med. 2023 Mar;155:106634. doi: 10.1016/j.compbiomed.2023.106634. Epub 2023 Feb 9.
8
Exploring the single-cell RNA-seq analysis landscape with the scRNA-tools database.探索单细胞 RNA-seq 分析图谱与 scRNA-tools 数据库。
PLoS Comput Biol. 2018 Jun 25;14(6):e1006245. doi: 10.1371/journal.pcbi.1006245. eCollection 2018 Jun.
9
scAnno: a deconvolution strategy-based automatic cell type annotation tool for single-cell RNA-sequencing data sets.scAnno:一种基于去卷积策略的单细胞 RNA 测序数据集自动细胞类型注释工具。
Brief Bioinform. 2023 May 19;24(3). doi: 10.1093/bib/bbad179.
10
Comparison of high-throughput single-cell RNA sequencing data processing pipelines.高通量单细胞 RNA 测序数据处理管道的比较。
Brief Bioinform. 2021 May 20;22(3). doi: 10.1093/bib/bbaa116.

引用本文的文献

1
Discovery of optimal cell type classification marker genes from single cell RNA sequencing data.从单细胞RNA测序数据中发现最佳细胞类型分类标记基因。
BMC Methods. 2024;1. doi: 10.1186/s44330-024-00015-2. Epub 2024 Nov 4.
2
DropDAE: Denosing Autoencoder with Contrastive Learning for Addressing Dropout Events in scRNA-seq Data.DropDAE:用于处理单细胞RNA测序数据中缺失值事件的基于对比学习的去噪自动编码器
Bioengineering (Basel). 2025 Jul 31;12(8):829. doi: 10.3390/bioengineering12080829.
3
GUIDING CLUSTERING AND ANNOTATION IN SINGLE-CELL RNA SEQUENCING USING THE AVERAGE OVERLAP METRIC.

本文引用的文献

1
Optimal marker gene selection for cell type discrimination in single cell analyses.单细胞分析中用于细胞类型区分的最优标记基因选择。
Nat Commun. 2021 Feb 19;12(1):1186. doi: 10.1038/s41467-021-21453-4.
2
Combinatorial prediction of marker panels from single-cell transcriptomic data.基于单细胞转录组学数据的组合标志物预测。
Mol Syst Biol. 2019 Oct;15(10):e9005. doi: 10.15252/msb.20199005.
3
Recovering Gene Interactions from Single-Cell Data Using Data Diffusion.利用数据扩散从单细胞数据中恢复基因相互作用。
使用平均重叠度量指导单细胞RNA测序中的聚类和注释
bioRxiv. 2025 May 10:2025.05.06.652497. doi: 10.1101/2025.05.06.652497.
4
CORTADO: Hill Climbing Optimization for Cell-Type Specific Marker Gene Discovery.科尔塔多:用于细胞类型特异性标记基因发现的爬山优化算法
bioRxiv. 2024 Dec 23:2024.12.23.630040. doi: 10.1101/2024.12.23.630040.
5
Hierarchical marker genes selection in scRNA-seq analysis.单细胞RNA测序分析中的分层标记基因选择
PLoS Comput Biol. 2024 Dec 12;20(12):e1012643. doi: 10.1371/journal.pcbi.1012643. eCollection 2024 Dec.
6
Homebuilt Imaging-Based Spatial Transcriptomics: Tertiary Lymphoid Structures as a Case Example.基于自建成像的空间转录组学:以三级淋巴结构为例。
Methods Mol Biol. 2025;2864:77-105. doi: 10.1007/978-1-0716-4184-2_5.
7
Spatial transcriptomic brain imaging reveals the effects of immunomodulation therapy on specific regional brain cells in a mouse dementia model.空间转录组学脑成像揭示了免疫调节疗法对小鼠痴呆模型特定区域脑细胞的影响。
BMC Genomics. 2024 May 25;25(1):516. doi: 10.1186/s12864-024-10434-8.
8
A comparison of marker gene selection methods for single-cell RNA sequencing data.单细胞 RNA 测序数据中标记基因选择方法的比较。
Genome Biol. 2024 Feb 26;25(1):56. doi: 10.1186/s13059-024-03183-0.
9
Scalable nonparametric clustering with unified marker gene selection for single-cell RNA-seq data.用于单细胞RNA测序数据的具有统一标记基因选择的可扩展非参数聚类
bioRxiv. 2024 Feb 12:2024.02.11.579839. doi: 10.1101/2024.02.11.579839.
10
uPAR (PLAUR) Marks Two Intra-Tumoral Subtypes of Glioblastoma: Insights from Single-Cell RNA Sequencing.uPAR(PLAUR)标记胶质母细胞瘤的两个肿瘤内亚型:单细胞 RNA 测序的见解。
Int J Mol Sci. 2024 Feb 7;25(4):1998. doi: 10.3390/ijms25041998.
Cell. 2018 Jul 26;174(3):716-729.e27. doi: 10.1016/j.cell.2018.05.061. Epub 2018 Jun 28.
4
Integrating single-cell transcriptomic data across different conditions, technologies, and species.整合不同条件、技术和物种的单细胞转录组数据。
Nat Biotechnol. 2018 Jun;36(5):411-420. doi: 10.1038/nbt.4096. Epub 2018 Apr 2.
5
An accurate and robust imputation method scImpute for single-cell RNA-seq data.一种用于单细胞 RNA-seq 数据的准确稳健的插补方法 scImpute。
Nat Commun. 2018 Mar 8;9(1):997. doi: 10.1038/s41467-018-03405-7.
6
Bias, robustness and scalability in single-cell differential expression analysis.单细胞差异表达分析中的偏差、稳健性和可扩展性。
Nat Methods. 2018 Apr;15(4):255-261. doi: 10.1038/nmeth.4612. Epub 2018 Feb 26.
7
SCANPY: large-scale single-cell gene expression data analysis.SCANPY:大规模单细胞基因表达数据分析。
Genome Biol. 2018 Feb 6;19(1):15. doi: 10.1186/s13059-017-1382-0.
8
Granatum: a graphical single-cell RNA-Seq analysis pipeline for genomics scientists.石榴石:一个用于基因组学科学家的图形单细胞 RNA-Seq 分析流程。
Genome Med. 2017 Dec 5;9(1):108. doi: 10.1186/s13073-017-0492-3.
9
Towards unified quality verification of synthetic count data with countsimQC.使用 countsimQC 实现综合计数数据的统一质量验证。
Bioinformatics. 2018 Feb 15;34(4):691-692. doi: 10.1093/bioinformatics/btx631.
10
Splatter: simulation of single-cell RNA sequencing data.Splatter:单细胞 RNA 测序数据模拟。
Genome Biol. 2017 Sep 12;18(1):174. doi: 10.1186/s13059-017-1305-0.