Geoinformation and Big Data Research Lab, Department of Geography, University of South Carolina, Columbia, SC, United States of America.
Department of Geosciences, University of Arkansas, Fayetteville, AR, United States of America.
PLoS One. 2020 Nov 10;15(11):e0241957. doi: 10.1371/journal.pone.0241957. eCollection 2020.
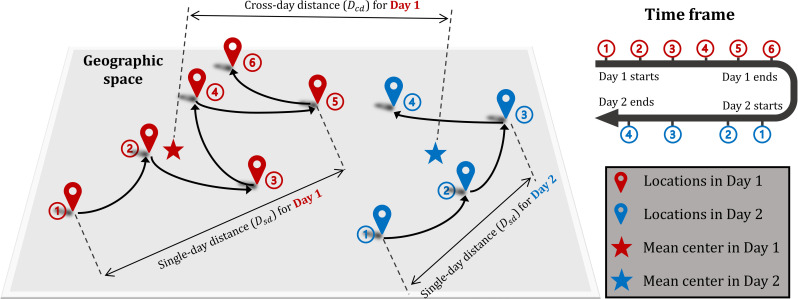
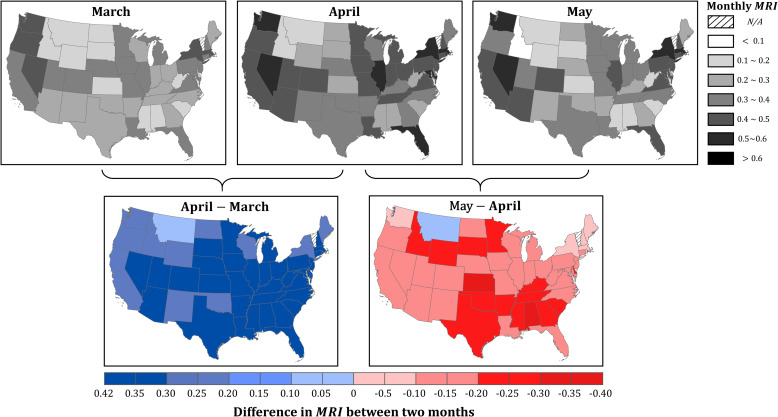
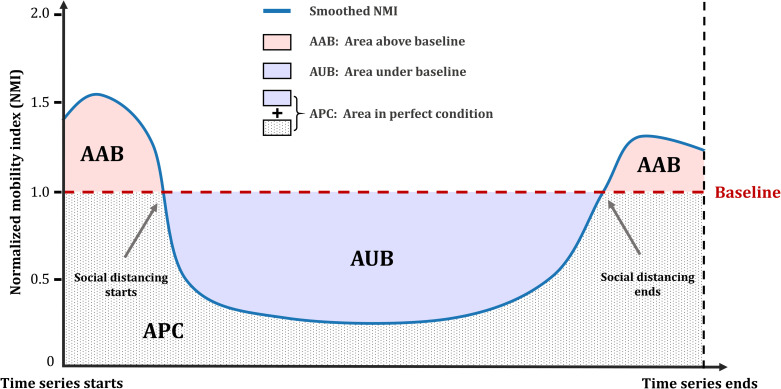
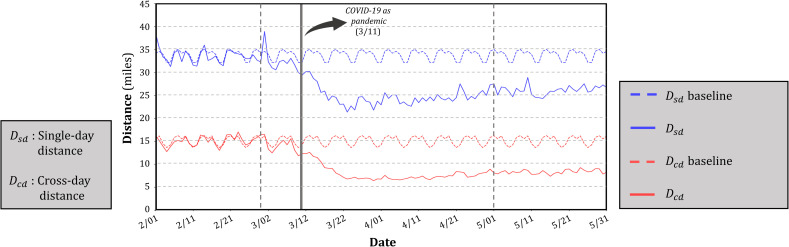
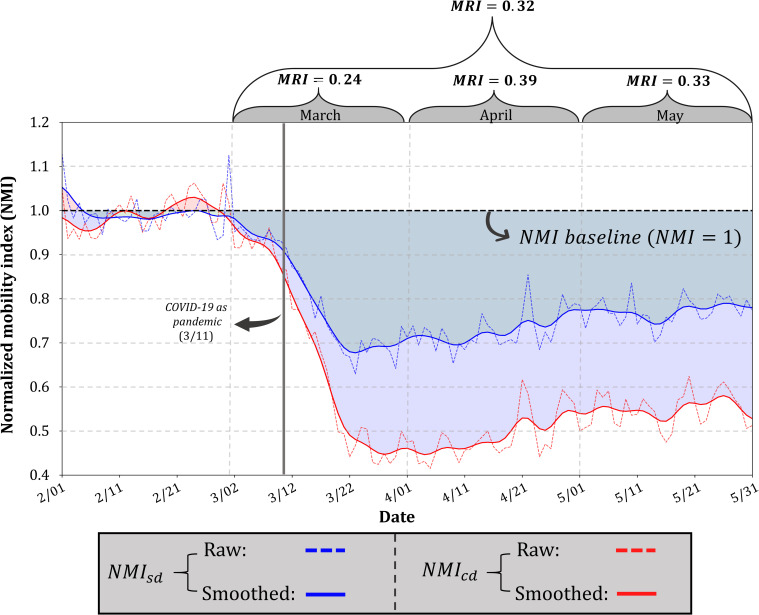
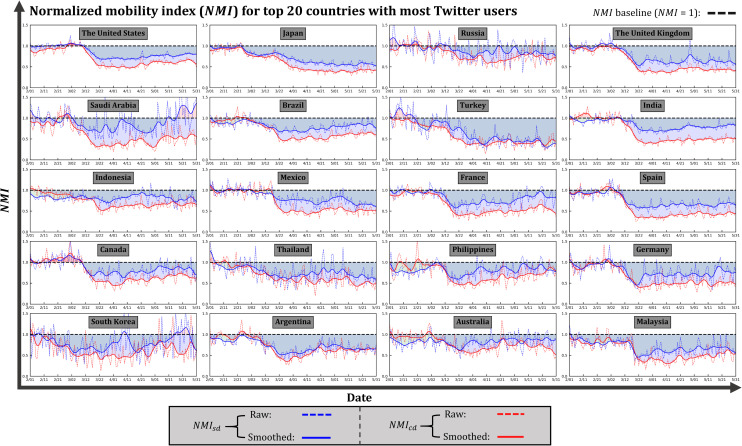
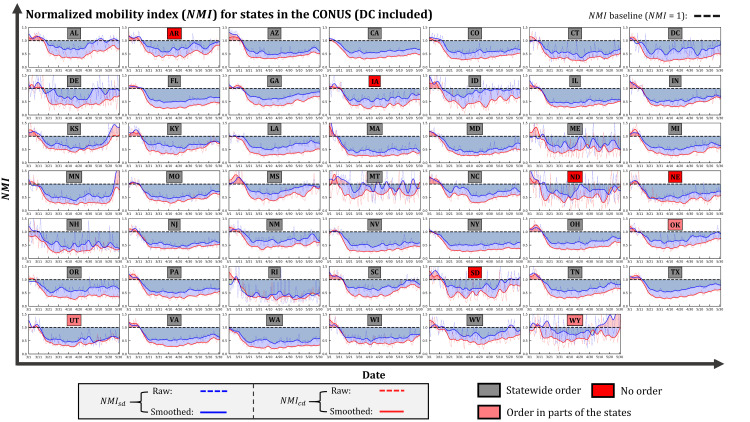
The current COVID-19 pandemic raises concerns worldwide, leading to serious health, economic, and social challenges. The rapid spread of the virus at a global scale highlights the need for a more harmonized, less privacy-concerning, easily accessible approach to monitoring the human mobility that has proven to be associated with viral transmission. In this study, we analyzed over 580 million tweets worldwide to see how global collaborative efforts in reducing human mobility are reflected from the user-generated information at the global, country, and U.S. state scale. Considering the multifaceted nature of mobility, we propose two types of distance: the single-day distance and the cross-day distance. To quantify the responsiveness in certain geographic regions, we further propose a mobility-based responsive index (MRI) that captures the overall degree of mobility changes within a time window. The results suggest that mobility patterns obtained from Twitter data are amenable to quantitatively reflect the mobility dynamics. Globally, the proposed two distances had greatly deviated from their baselines after March 11, 2020, when WHO declared COVID-19 as a pandemic. The considerably less periodicity after the declaration suggests that the protection measures have obviously affected people's travel routines. The country scale comparisons reveal the discrepancies in responsiveness, evidenced by the contrasting mobility patterns in different epidemic phases. We find that the triggers of mobility changes correspond well with the national announcements of mitigation measures, proving that Twitter-based mobility implies the effectiveness of those measures. In the U.S., the influence of the COVID-19 pandemic on mobility is distinct. However, the impacts vary substantially among states.
当前的 COVID-19 大流行引起了全球关注,给健康、经济和社会带来了严重挑战。病毒在全球范围内的迅速传播,凸显了需要采取更加协调、隐私问题较少、易于获取的方法来监测与病毒传播相关的人类流动性。在本研究中,我们分析了全球超过 5.8 亿条推文,以了解从用户生成的信息中如何反映全球合作努力减少人类流动性,这些信息来自全球、国家和美国各州的层面。考虑到流动性的多面性,我们提出了两种距离:单日距离和跨日距离。为了量化某些地理区域的响应能力,我们进一步提出了基于流动性的响应指数(MRI),该指数可以捕捉在时间窗口内的整体流动性变化程度。结果表明,从 Twitter 数据中获取的流动性模式可以定量反映流动性动态。从全球范围来看,自 2020 年 3 月 11 日世界卫生组织宣布 COVID-19 为大流行以来,这两种距离与基线相比都有很大的偏离。宣布之后,周期明显减少,这表明保护措施明显影响了人们的旅行习惯。国家层面的比较揭示了响应能力的差异,这在不同的疫情阶段的流动性模式中得到了证明。我们发现,流动性变化的触发因素与缓解措施的国家公告相符,这证明了基于 Twitter 的流动性反映了这些措施的有效性。在美国,COVID-19 大流行对流动性的影响是明显的。然而,各州之间的影响差异很大。