Department of Statistical and Actuarial Sciences, University of Western Ontario, London, Ontario, Canada.
Department of Computer Science, University of Western Ontario, London, Ontario, Canada.
PLoS One. 2021 Jan 19;16(1):e0244536. doi: 10.1371/journal.pone.0244536. eCollection 2021.
Since March 11, 2020 when the World Health Organization (WHO) declared the COVID-19 pandemic, the number of infected cases, the number of deaths, and the number of affected countries have climbed rapidly. To understand the impact of COVID-19 on public health, many studies have been conducted for various countries. To complement the available work, in this article we examine Canadian COVID-19 data for the period of March 18, 2020 to August 16, 2020 with the aim to forecast the dynamic trend in a short term.
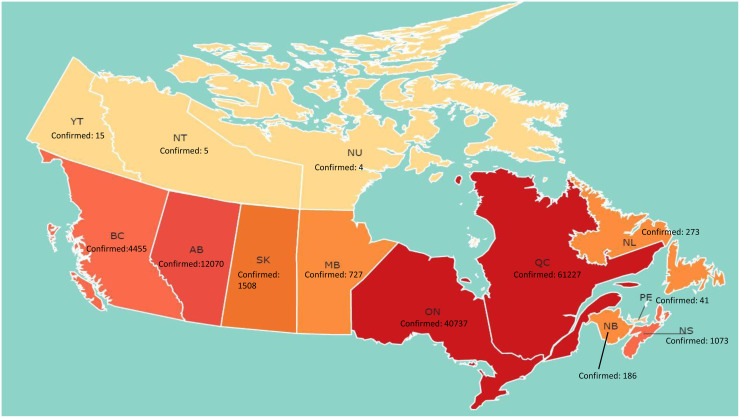
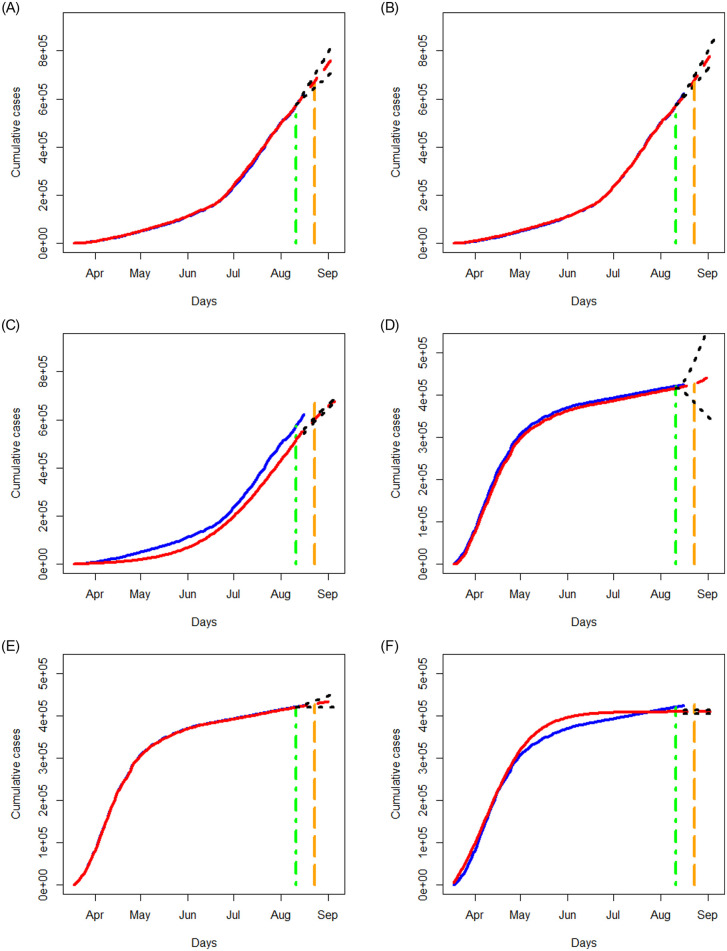
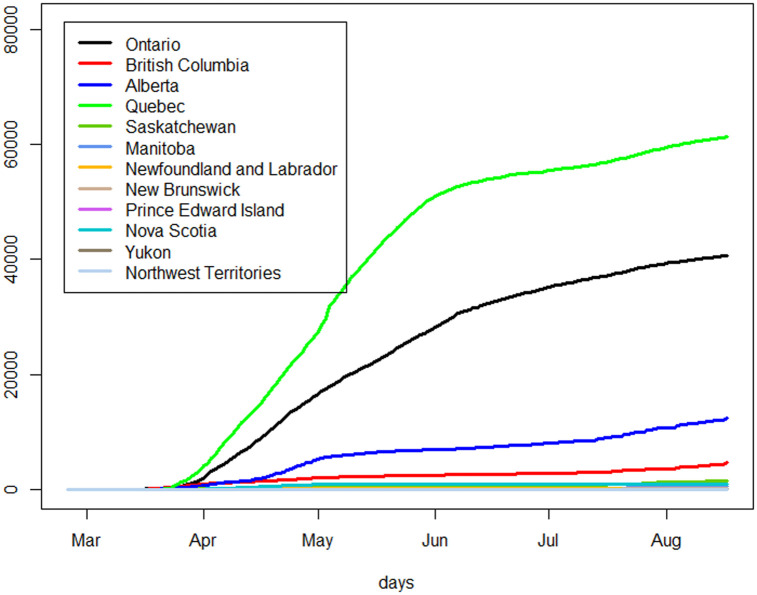
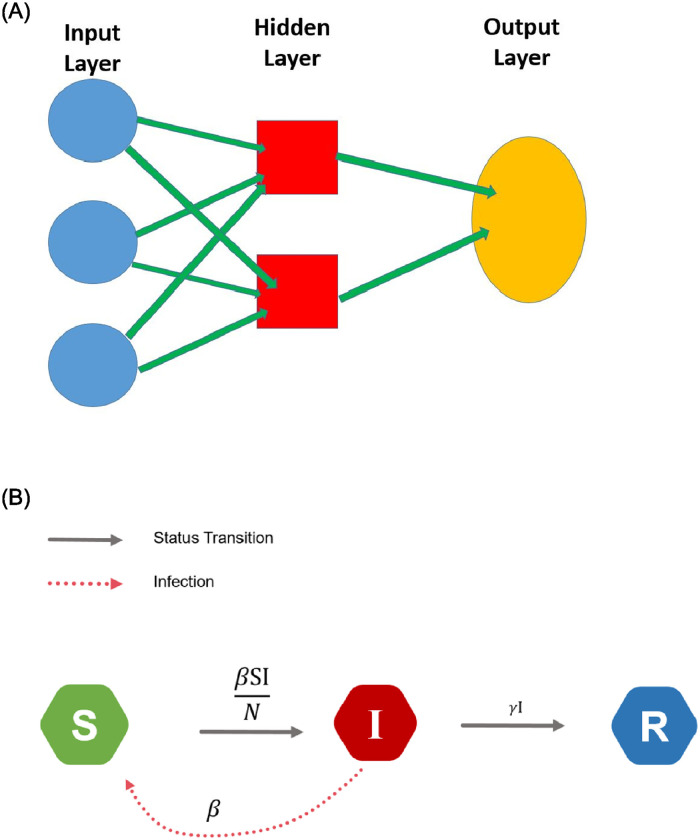
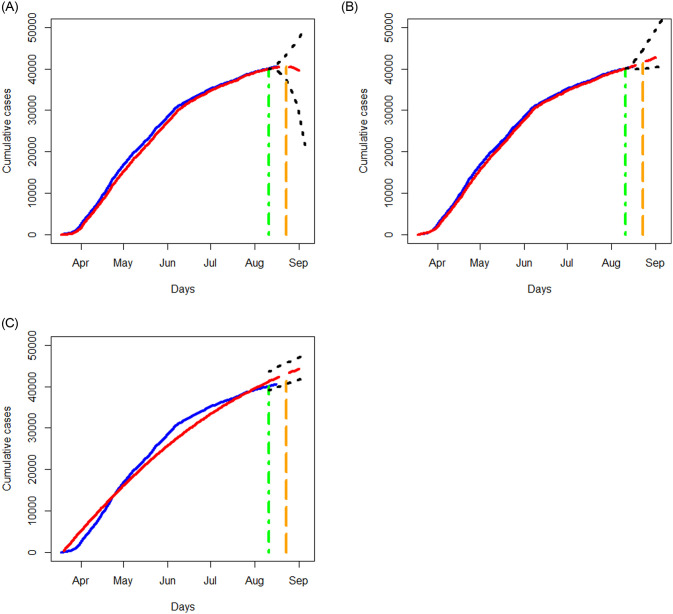
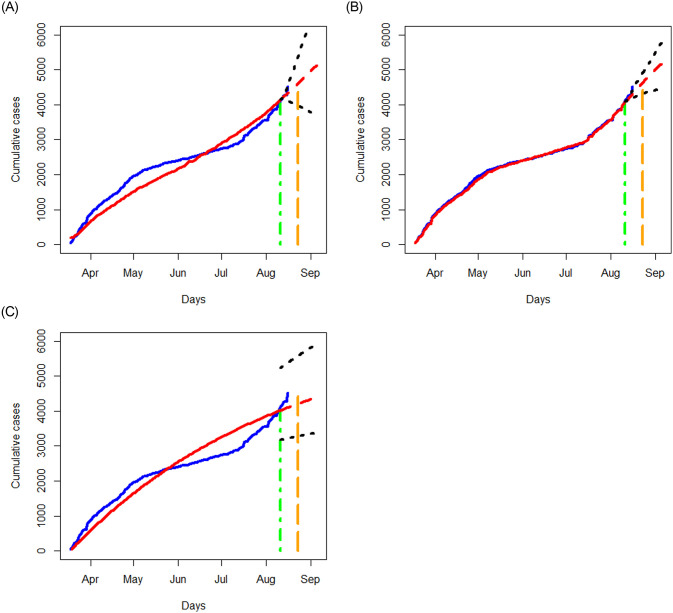
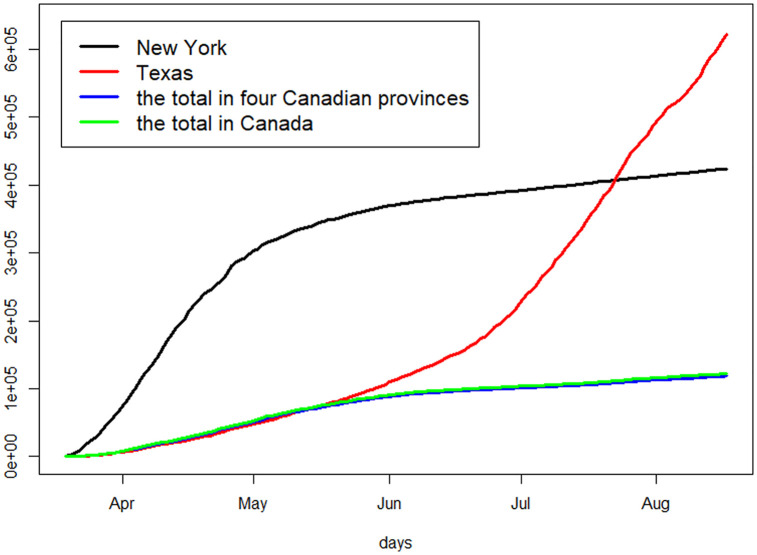
We focus our attention on Canadian data and analyze the four provinces, Ontario, Alberta, British Columbia, and Quebec, which have the most severe situations in Canada. To build predictive models and conduct prediction, we employ three models, smooth transition autoregressive (STAR) models, neural network (NN) models, and susceptible-infected-removed (SIR) models, to fit time series data of confirmed cases in the four provinces separately. In comparison, we also analyze the data of daily infections in two states of USA, Texas and New York state, for the period of March 18, 2020 to August 16, 2020. We emphasize that different models make different assumptions which are basically difficult to validate. Yet invoking different models allows us to examine the data from different angles, thus, helping reveal the underlying trajectory of the development of COVID-19 in Canada.
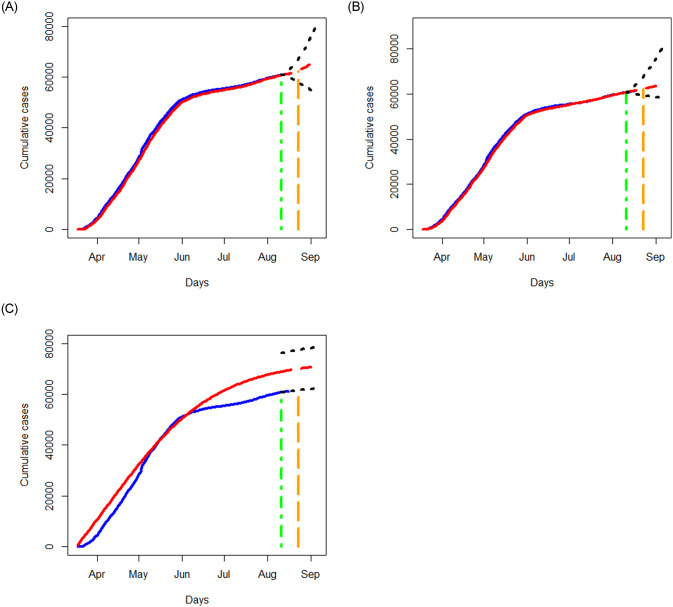
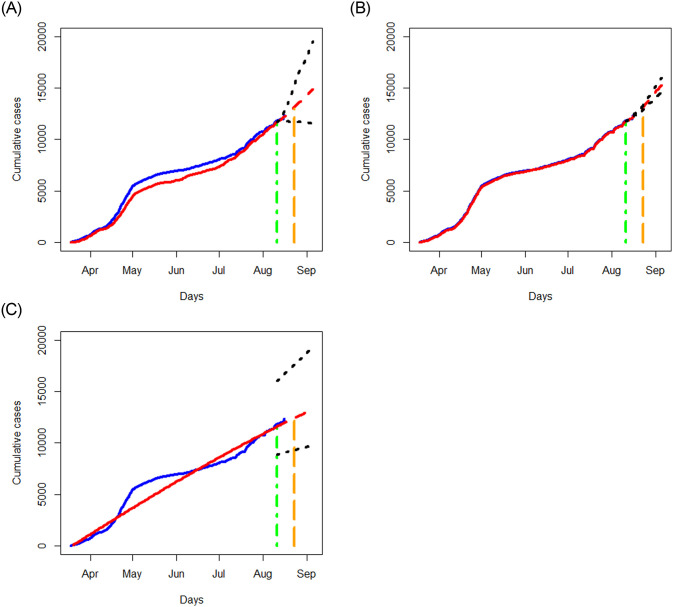
The examinations of the data dated from March 18, 2020 to August 11, 2020 show that the STAR, NN, and SIR models may output different results, though the differences are small in some cases. Prediction over a short term period incurs smaller prediction variability than over a long term period, as expected. The NN method tends to outperform other two methods. All the methods forecast an upward trend in all the four Canadian provinces for the period of August 12, 2020 to August 23, 2020, though the degree varies from method to method. This research offers model-based insights into the pandemic evolvement in Canada.
自 2020 年 3 月 11 日世界卫生组织(WHO)宣布 COVID-19 大流行以来,感染病例、死亡人数和受影响国家的数量迅速攀升。为了了解 COVID-19 对公共卫生的影响,许多国家进行了研究。为了补充现有工作,本文研究了 2020 年 3 月 18 日至 2020 年 8 月 16 日期间加拿大的 COVID-19 数据,旨在短期预测其动态趋势。
我们关注加拿大的数据,分析加拿大疫情最严重的四个省份安大略省、艾伯塔省、不列颠哥伦比亚省和魁北克省。为了构建预测模型和进行预测,我们分别采用了三种模型,即平稳转移自回归(STAR)模型、神经网络(NN)模型和易感感染清除(SIR)模型,对这四个省份的确诊病例时间序列数据进行拟合。相比之下,我们还分析了 2020 年 3 月 18 日至 2020 年 8 月 16 日期间美国德克萨斯州和纽约州的每日感染数据。我们强调,不同的模型有不同的假设,这些假设基本上很难验证。然而,调用不同的模型可以让我们从不同的角度来分析数据,从而帮助揭示 COVID-19 在加拿大的发展轨迹。
对 2020 年 3 月 18 日至 2020 年 8 月 11 日的数据进行分析表明,STAR、NN 和 SIR 模型可能会输出不同的结果,尽管在某些情况下差异很小。短期预测比长期预测的预测变化更小,这是意料之中的。NN 方法往往优于其他两种方法。所有方法都预测 2020 年 8 月 12 日至 2020 年 8 月 23 日期间加拿大四个省份的病例数呈上升趋势,尽管程度因方法而异。本研究为加拿大大流行的演变提供了基于模型的见解。