Buehler Center for Health Policy and Economics, Feinberg School of Medicine, Northwestern University, Chicago, IL, United States.
Feinberg School of Medicine, Northwestern University, Chicago, IL, United States.
JMIR Public Health Surveill. 2021 May 10;7(5):e25753. doi: 10.2196/25753.
The COVID-19 global pandemic has disrupted structures and communities across the globe. Numerous regions of the world have had varying responses in their attempts to contain the spread of the virus. Factors such as public health policies, governance, and sociopolitical climate have led to differential levels of success at controlling the spread of SARS-CoV-2. Ultimately, a more advanced surveillance metric for COVID-19 transmission is necessary to help government systems and national leaders understand which responses have been effective and gauge where outbreaks occur.
The goal of this study is to provide advanced COVID-19 surveillance metrics for Canada at the country, province, and territory level that account for shifts in the pandemic including speed, acceleration, jerk, and persistence. Enhanced surveillance identifies risks for explosive growth and regions that have controlled outbreaks successfully.
Using a longitudinal trend analysis study design, we extracted 62 days of COVID-19 data from Canadian public health registries for 13 provinces and territories. We used an empirical difference equation to measure the daily number of cases in Canada as a function of the prior number of cases, the level of testing, and weekly shift variables based on a dynamic panel model that was estimated using the generalized method of moments approach by implementing the Arellano-Bond estimator in R.
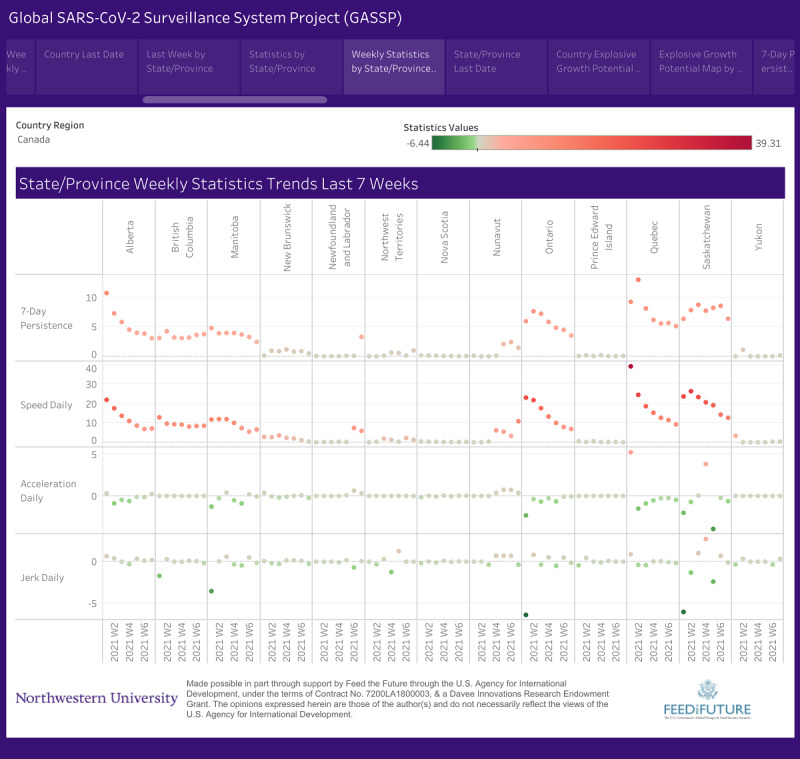
We compare the week of February 7-13, 2021, with the week of February 14-20, 2021. Canada, as a whole, had a decrease in speed from 8.4 daily new cases per 100,000 population to 7.5 daily new cases per 100,000 population. The persistence of new cases during the week of February 14-20 reported 7.5 cases that are a result of COVID-19 transmissions 7 days earlier. The two most populous provinces of Ontario and Quebec both experienced decreases in speed from 7.9 and 11.5 daily new cases per 100,000 population for the week of February 7-13 to speeds of 6.9 and 9.3 for the week of February 14-20, respectively. Nunavut experienced a significant increase in speed during this time, from 3.3 daily new cases per 100,000 population to 10.9 daily new cases per 100,000 population.
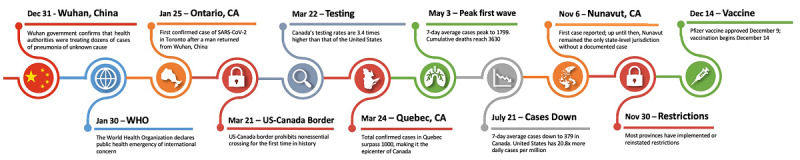
Canada excelled at COVID-19 control early on in the pandemic, especially during the first COVID-19 shutdown. The second wave at the end of 2020 resulted in a resurgence of the outbreak, which has since been controlled. Enhanced surveillance identifies outbreaks and where there is the potential for explosive growth, which informs proactive health policy.
COVID-19 全球大流行扰乱了全球各地的结构和社区。世界上许多地区在试图控制病毒传播方面采取了不同的措施。公共卫生政策、治理和社会政治气候等因素导致在控制 SARS-CoV-2 传播方面取得了不同程度的成功。最终,需要更先进的 COVID-19 传播监测指标,以帮助政府系统和国家领导人了解哪些措施有效,并评估疫情爆发的情况。
本研究的目的是为加拿大提供国家级、省级和地区级的先进 COVID-19 监测指标,这些指标考虑了疫情的变化,包括速度、加速度、急动度和持久性。增强的监测可以识别出爆发风险和已成功控制疫情的地区。
使用纵向趋势分析研究设计,我们从加拿大公共卫生登记处提取了 13 个省和地区的 62 天 COVID-19 数据。我们使用经验差分方程来衡量加拿大每天的病例数是前一天病例数、检测水平以及基于动态面板模型的每周变化变量的函数,该模型使用广义矩估计方法通过在 R 中实施 Arellano-Bond 估计器进行估计。
我们将 2021 年 2 月 7 日至 13 日这一周与 2021 年 2 月 14 日至 20 日这一周进行了比较。加拿大整体速度从每 10 万人 8.4 例新病例下降到每 10 万人 7.5 例新病例。2 月 14 日至 20 日这一周报告的 7.5 例新病例是 COVID-19 传播 7 天前的结果。人口最多的两个省份安大略省和魁北克省的速度都有所下降,从 2 月 7 日至 13 日的每周 7.9 和 11.5 例新病例下降到 2 月 14 日至 20 日的每周 6.9 和 9.3 例新病例。努纳武特地区在此期间速度显著加快,从每 10 万人 3.3 例新病例增加到每 10 万人 10.9 例新病例。
加拿大在疫情早期,尤其是在第一次 COVID-19 关闭期间,对 COVID-19 的控制非常出色。2020 年底的第二波疫情导致疫情再次爆发,此后已得到控制。增强的监测可以识别疫情爆发的情况以及潜在的爆发风险,为积极主动的卫生政策提供信息。