• 文献检索
  • 文档翻译
  • 深度研究
  • 学术资讯
  • Suppr Zotero 插件Zotero 插件
  • 邀请有礼
  • 套餐&价格
  • 历史记录
应用&插件
Suppr Zotero 插件Zotero 插件浏览器插件Mac 客户端Windows 客户端微信小程序
定价
高级版会员购买积分包购买API积分包
服务
文献检索文档翻译深度研究API 文档MCP 服务
关于我们
关于 Suppr公司介绍联系我们用户协议隐私条款
关注我们

Suppr 超能文献

核心技术专利:CN118964589B侵权必究
粤ICP备2023148730 号-1Suppr @ 2026

文献检索

告别复杂PubMed语法,用中文像聊天一样搜索,搜遍4000万医学文献。AI智能推荐,让科研检索更轻松。

立即免费搜索

文件翻译

保留排版,准确专业,支持PDF/Word/PPT等文件格式,支持 12+语言互译。

免费翻译文档

深度研究

AI帮你快速写综述,25分钟生成高质量综述,智能提取关键信息,辅助科研写作。

立即免费体验

预期死亡人数的短期预测。

Short-term forecasts of expected deaths.

作者信息

Rizzi Silvia, Vaupel James W

机构信息

Interdisciplinary Centre on Population Dynamics, University of Southern Denmark, 5230 Odense M, Denmark.

Interdisciplinary Centre on Population Dynamics, University of Southern Denmark, 5230 Odense M, Denmark

出版信息

Proc Natl Acad Sci U S A. 2021 Apr 13;118(15). doi: 10.1073/pnas.2025324118.

DOI:10.1073/pnas.2025324118
PMID:33771934
原文链接:https://pmc.ncbi.nlm.nih.gov/articles/PMC8053952/
Abstract

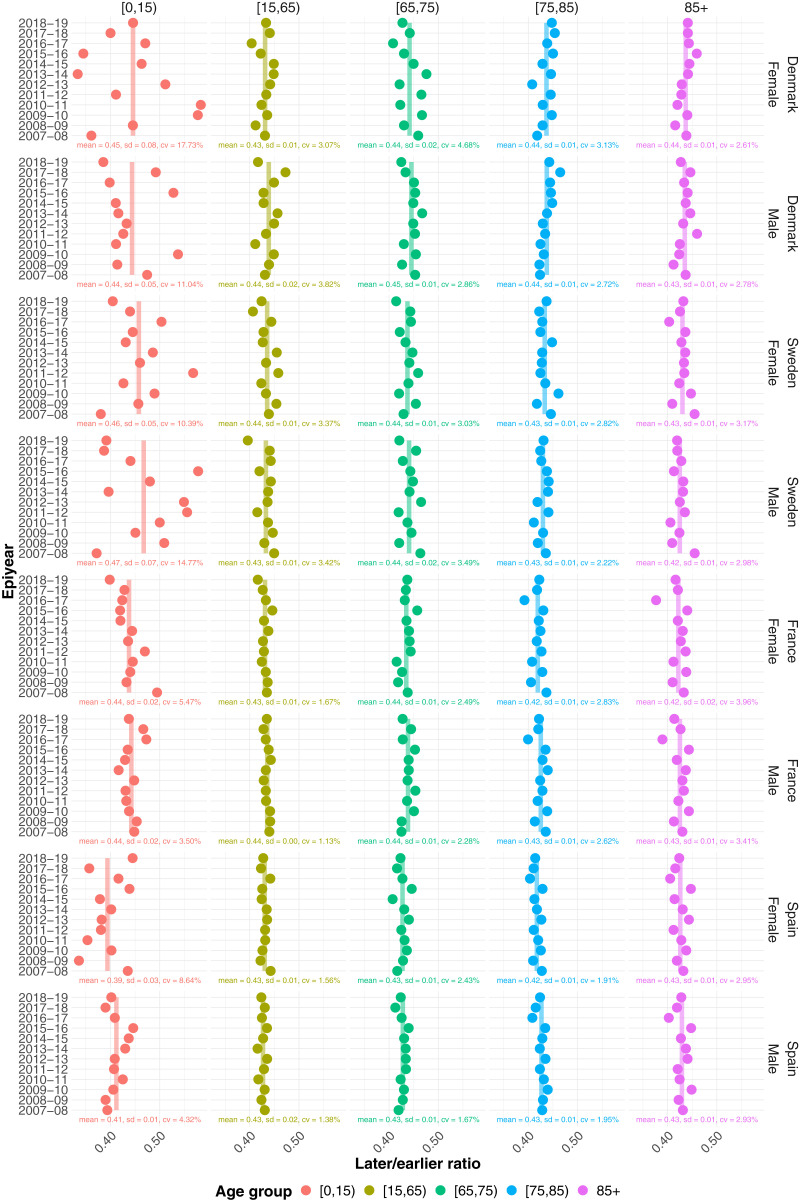
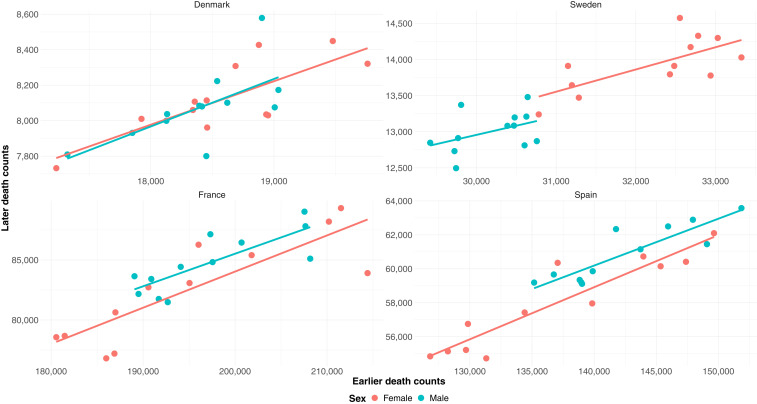
We introduce a method for making short-term mortality forecasts of a few months, illustrating it by estimating how many deaths might have happened if some major shock had not occurred. We apply the method to assess excess mortality from March to June 2020 in Denmark and Sweden as a result of the first wave of the coronavirus pandemic; associated policy interventions; and behavioral, healthcare, social, and economic changes. We chose to compare Denmark and Sweden because reliable data were available and because the two countries are similar but chose different responses to COVID-19: Denmark imposed a rather severe lockdown; Sweden did not. We make forecasts by age and sex to predict expected deaths if COVID-19 had not struck. Subtracting these forecasts from observed deaths gives the excess death count. Excess deaths were lower in Denmark than Sweden during the first wave of the pandemic. The later/earlier ratio we propose for shortcasting is easy to understand, requires less data than more elaborate approaches, and may be useful in many countries in making both predictions about the future and the past to study the impact on mortality of coronavirus and other epidemics. In the application to Denmark and Sweden, prediction intervals are narrower and bias is less than when forecasts are based on averages of the last 5 y, as is often done. More generally, later/earlier ratios may prove useful in short-term forecasting of illnesses and births as well as economic and other activity that varies seasonally or periodically.

摘要

我们介绍了一种用于进行几个月短期死亡率预测的方法,并通过估计如果没有发生某些重大冲击可能会发生多少死亡来加以说明。我们将该方法应用于评估丹麦和瑞典在2020年3月至6月因新冠疫情第一波、相关政策干预措施以及行为、医疗保健、社会和经济变化而导致的超额死亡率。我们选择比较丹麦和瑞典,是因为有可靠的数据可用,而且两国情况相似,但对新冠疫情采取了不同的应对措施:丹麦实施了相当严格的封锁;瑞典则没有。我们按年龄和性别进行预测,以预测如果没有新冠疫情爆发预期的死亡人数。用观察到的死亡人数减去这些预测值,就得到超额死亡人数。在疫情第一波期间,丹麦的超额死亡人数低于瑞典。我们提出的用于短期预测的后期/前期比率易于理解,所需数据比更复杂的方法少,并且在许多国家对于研究新冠病毒和其他流行病对死亡率的影响、对未来和过去进行预测可能都很有用。在应用于丹麦和瑞典时,预测区间比通常基于过去5年平均值进行预测时更窄,偏差也更小。更普遍地说,后期/前期比率可能在疾病、出生以及季节性或周期性变化的经济和其他活动的短期预测中证明是有用的。

https://cdn.ncbi.nlm.nih.gov/pmc/blobs/a3ed/8053952/21294641f305/pnas.2025324118fig02.jpg
https://cdn.ncbi.nlm.nih.gov/pmc/blobs/a3ed/8053952/044c151d4789/pnas.2025324118fig01.jpg
https://cdn.ncbi.nlm.nih.gov/pmc/blobs/a3ed/8053952/21294641f305/pnas.2025324118fig02.jpg
https://cdn.ncbi.nlm.nih.gov/pmc/blobs/a3ed/8053952/044c151d4789/pnas.2025324118fig01.jpg
https://cdn.ncbi.nlm.nih.gov/pmc/blobs/a3ed/8053952/21294641f305/pnas.2025324118fig02.jpg

相似文献

1
Short-term forecasts of expected deaths.预期死亡人数的短期预测。
Proc Natl Acad Sci U S A. 2021 Apr 13;118(15). doi: 10.1073/pnas.2025324118.
2
Cause-specific excess mortality in Denmark, Finland, Norway, and Sweden during the COVID-19 pandemic 2020-2022: a study using nationwide population data.2020-2022 年 COVID-19 大流行期间丹麦、芬兰、挪威和瑞典的特定原因超额死亡率:一项使用全国人口数据的研究。
Eur J Epidemiol. 2024 Sep;39(9):1037-1050. doi: 10.1007/s10654-024-01154-0. Epub 2024 Sep 16.
3
Excess mortality in Denmark, Finland, Norway and Sweden during the COVID-19 pandemic 2020-2022.2020 - 2022年新冠疫情期间丹麦、芬兰、挪威和瑞典的超额死亡率
Eur J Public Health. 2024 Aug 1;34(4):737-743. doi: 10.1093/eurpub/ckae091.
4
Month-to-month all-cause mortality forecasting: a method allowing for changes in seasonal patterns.逐月全因死亡率预测:一种考虑季节性模式变化的方法。
Am J Epidemiol. 2024 Jun 3;193(6):898-907. doi: 10.1093/aje/kwae004.
5
High excess deaths in Sweden during the first wave of COVID-19: Policy deficiencies or 'dry tinder'?高超额死亡率在瑞典在 COVID-19 的第一波期间:政策缺陷还是“干柴”?
Scand J Public Health. 2022 Feb;50(1):33-37. doi: 10.1177/14034948211027818. Epub 2021 Jul 2.
6
Excess deaths associated with covid-19 pandemic in 2020: age and sex disaggregated time series analysis in 29 high income countries.2020 年与新冠大流行相关的超额死亡人数:29 个高收入国家按年龄和性别细分的时间序列分析。
BMJ. 2021 May 19;373:n1137. doi: 10.1136/bmj.n1137.
7
[Sex/gender differences in COVID-19 lethality: what the data say, and do not say].[新冠病毒病致死率中的性别差异:数据所表明及未表明的情况]
Epidemiol Prev. 2020 Sep-Dec;44(5-6 Suppl 2):400-406. doi: 10.19191/EP20.5-6.S2.145.
8
Short-term real-time prediction of total number of reported COVID-19 cases and deaths in South Africa: a data driven approach.南非报告的 COVID-19 病例和死亡总数的短期实时预测:一种数据驱动的方法。
BMC Med Res Methodol. 2021 Jan 11;21(1):15. doi: 10.1186/s12874-020-01165-x.
9
A comparison of COVID-19 epidemiological indicators in Sweden, Norway, Denmark, and Finland.瑞典、挪威、丹麦和芬兰新冠肺炎流行病学指标的比较。
Scand J Public Health. 2021 Feb;49(1):69-78. doi: 10.1177/1403494820980264. Epub 2021 Jan 7.
10
Variation in excess all-cause mortality by age, sex, and province during the first wave of the COVID-19 pandemic in Italy.意大利 COVID-19 大流行第一波期间按年龄、性别和省份划分的超额全因死亡率变化。
Sci Rep. 2022 Jan 20;12(1):1077. doi: 10.1038/s41598-022-04993-7.

引用本文的文献

1
Month-to-month all-cause mortality forecasting: a method allowing for changes in seasonal patterns.逐月全因死亡率预测:一种考虑季节性模式变化的方法。
Am J Epidemiol. 2024 Jun 3;193(6):898-907. doi: 10.1093/aje/kwae004.
2
Stress/depression across the COVID-19 pandemic in Denmark.丹麦在 COVID-19 大流行期间的压力/抑郁情况。
BMC Public Health. 2023 Jan 25;23(1):169. doi: 10.1186/s12889-023-15129-5.
3
Sex-differences in excess death risk during the COVID-19 pandemic: an analysis of the first wave across Italian regions. What have we learned?

本文引用的文献

1
Demographic perspectives on the rise of longevity.人口学视角下的长寿崛起。
Proc Natl Acad Sci U S A. 2021 Mar 2;118(9). doi: 10.1073/pnas.2019536118.
2
Magnitude, demographics and dynamics of the effect of the first wave of the COVID-19 pandemic on all-cause mortality in 21 industrialized countries.新冠大流行第一波对 21 个工业化国家全因死亡率影响的规模、人口统计学特征和动态。
Nat Med. 2020 Dec;26(12):1919-1928. doi: 10.1038/s41591-020-1112-0. Epub 2020 Oct 14.
3
Temporal dynamics in total excess mortality and COVID-19 deaths in Italian cities.
新冠疫情期间超额死亡风险的性别差异:意大利各地区首波疫情分析。我们学到了什么?
Genus. 2022;78(1):24. doi: 10.1186/s41118-022-00172-8. Epub 2022 Aug 6.
4
Sensitivity Analysis of Excess Mortality due to the COVID-19 Pandemic.2019年冠状病毒病大流行导致的超额死亡率敏感性分析
Popul Dev Rev. 2022 Jun;48(2):279-302. doi: 10.1111/padr.12475. Epub 2022 Mar 3.
5
The short-term mortality fluctuation data series, monitoring mortality shocks across time and space.短期死亡率波动数据序列,监测跨时间和空间的死亡率冲击。
Sci Data. 2021 Sep 6;8(1):235. doi: 10.1038/s41597-021-01019-1.
6
High excess deaths in Sweden during the first wave of COVID-19: Policy deficiencies or 'dry tinder'?高超额死亡率在瑞典在 COVID-19 的第一波期间:政策缺陷还是“干柴”?
Scand J Public Health. 2022 Feb;50(1):33-37. doi: 10.1177/14034948211027818. Epub 2021 Jul 2.
7
Excess deaths associated with covid-19 pandemic in 2020: age and sex disaggregated time series analysis in 29 high income countries.2020 年与新冠大流行相关的超额死亡人数:29 个高收入国家按年龄和性别细分的时间序列分析。
BMJ. 2021 May 19;373:n1137. doi: 10.1136/bmj.n1137.
意大利城市总超额死亡率和 COVID-19 死亡人数的时间动态。
BMC Public Health. 2020 Aug 14;20(1):1238. doi: 10.1186/s12889-020-09335-8.
4
Influenza-associated mortality determined from all-cause mortality, Denmark 2010/11-2016/17: The FluMOMO model.基于全因死亡率确定的 2010/11-2016/17 年丹麦流感相关死亡率:FluMOMO 模型。
Influenza Other Respir Viruses. 2018 Sep;12(5):591-604. doi: 10.1111/irv.12564. Epub 2018 May 6.
5
The causal pie model: an epidemiological method applied to evolutionary biology and ecology.因果分解模型:一种应用于进化生物学和生态学的流行病学方法。
Ecol Evol. 2014 May;4(10):1924-30. doi: 10.1002/ece3.1074. Epub 2014 Apr 19.
6
Excess mortality related to seasonal influenza and extreme temperatures in Denmark, 1994-2010.丹麦 1994-2010 年季节性流感和极端温度相关的超额死亡率。
BMC Infect Dis. 2011 Dec 16;11:350. doi: 10.1186/1471-2334-11-350.
7
Time series methods for obtaining excess mortality attributable to influenza epidemics.时间序列方法在获得流感流行导致的超额死亡率中的应用。
Stat Methods Med Res. 2011 Aug;20(4):331-45. doi: 10.1177/0962280209340201. Epub 2010 Mar 8.
8
Methods for current statistical analysis of excess pneumonia-influenza deaths.当前过量肺炎-流感死亡统计分析方法。
Public Health Rep (1896). 1963 Jun;78(6):494-506.
9
Modulation models for seasonal time series and incidence tables.季节性时间序列和发病率表的调制模型。
Stat Med. 2008 Jul 30;27(17):3430-41. doi: 10.1002/sim.3188.
10
Methods for monitoring influenza surveillance data.监测流感监测数据的方法。
Int J Epidemiol. 2006 Oct;35(5):1314-21. doi: 10.1093/ije/dyl162. Epub 2006 Aug 22.