• 文献检索
  • 文档翻译
  • 深度研究
  • 学术资讯
  • Suppr Zotero 插件Zotero 插件
  • 邀请有礼
  • 套餐&价格
  • 历史记录
应用&插件
Suppr Zotero 插件Zotero 插件浏览器插件Mac 客户端Windows 客户端微信小程序
定价
高级版会员购买积分包购买API积分包
服务
文献检索文档翻译深度研究API 文档MCP 服务
关于我们
关于 Suppr公司介绍联系我们用户协议隐私条款
关注我们

Suppr 超能文献

核心技术专利:CN118964589B侵权必究
粤ICP备2023148730 号-1Suppr @ 2026

文献检索

告别复杂PubMed语法,用中文像聊天一样搜索,搜遍4000万医学文献。AI智能推荐,让科研检索更轻松。

立即免费搜索

文件翻译

保留排版,准确专业,支持PDF/Word/PPT等文件格式,支持 12+语言互译。

免费翻译文档

深度研究

AI帮你快速写综述,25分钟生成高质量综述,智能提取关键信息,辅助科研写作。

立即免费体验

全球范围内的 COVID-19 分析:与死亡率相关的总病例、死亡、检测、社会经济和发病率因素,以及 2020-2021 年的预测分析。

Continent-Wide Analysis of COVID 19: Total Cases, Deaths, Tests, Socio-Economic, and Morbidity Factors Associated to the Mortality Rate, and Forecasting Analysis in 2020-2021.

机构信息

Department of Biology, College of Science, University of Bahrain, Sakhir 32038, Bahrain.

出版信息

Int J Environ Res Public Health. 2021 May 18;18(10):5350. doi: 10.3390/ijerph18105350.

DOI:10.3390/ijerph18105350
PMID:34069764
原文链接:https://pmc.ncbi.nlm.nih.gov/articles/PMC8157209/
Abstract

BACKGROUND

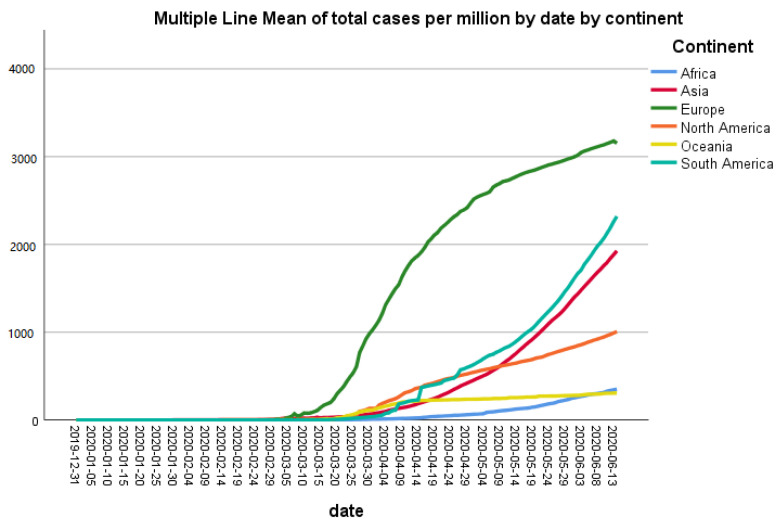
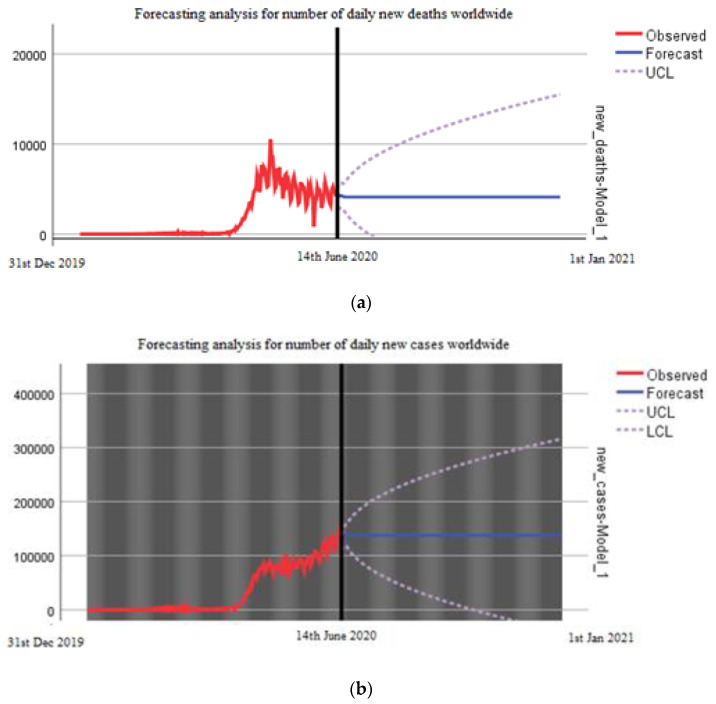
The severe acute respiratory syndrome coronavirus 2 (SARS-CoV-2) was first reported in China in December 2019 and has become a pandemic that resulted in more than one million deaths and infected over 35 million people worldwide. In this study, a continent-wide analysis of COVID-19 cases from 31st December 2019 to 14th June 2020 was performed along with socio-economic factors associated with mortality rates as well as a predicted future scenario of COVID-19 cases until the end of 2020.

METHODS

Epidemiological and statistical tools such as linear regression, Pearson's correlation analysis, and the Auto Regressive Integrated Moving Average (ARIMA) model were used in this study.

RESULTS

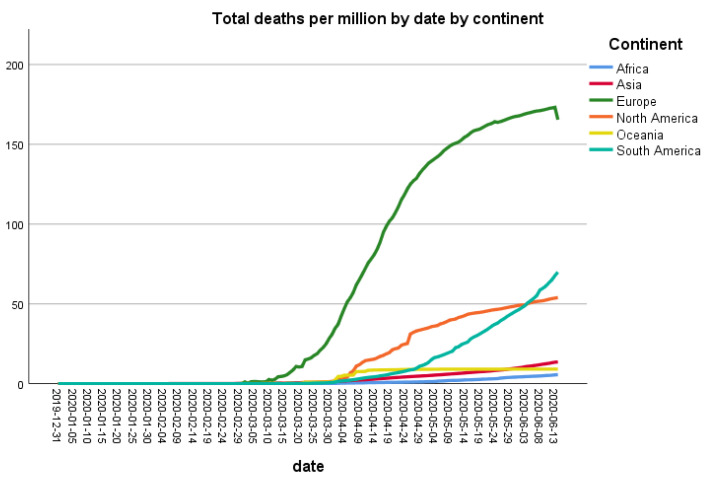
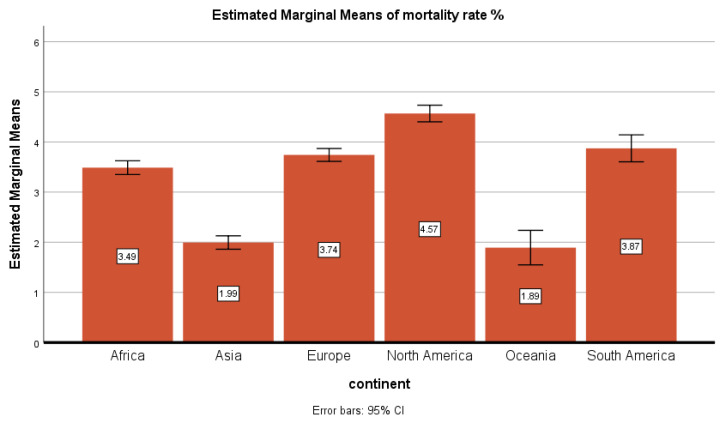
This study shows that the highest number of cases per million population was recorded in Europe, while the trend of new cases is lowest in Africa. The mortality rates in different continents were as follows: North America 4.57%, Europe 3.74%, South America 3.87%, Africa 3.49%, Oceania and Asia less than 2%. Linear regression analysis showed that hospital beds, GDP, diabetes, and higher average age were the significant risk factors for mortality in different continents. The forecasting analysis since the first case of COVID-19 until 1st January 2021 showed that the worst scenario at the end of 2020 predicts a range from 0 to 300,000 daily new cases and a range from 0 to 16,000 daily new deaths.

CONCLUSION

Epidemiological and clinical features of COVID-19 should be better defined, since they can play an import role in future strategies to control this pandemic.

摘要

背景

严重急性呼吸综合征冠状病毒 2(SARS-CoV-2)于 2019 年 12 月在中国首次报告,并已成为一种大流行疾病,导致全球超过 100 万人死亡,超过 3500 万人感染。在这项研究中,对 2019 年 12 月 31 日至 2020 年 6 月 14 日期间的 COVID-19 病例进行了全大陆分析,并结合与死亡率相关的社会经济因素以及到 2020 年底 COVID-19 病例的预测未来情景。

方法

本研究使用了流行病学和统计工具,如线性回归、皮尔逊相关分析和自回归综合移动平均(ARIMA)模型。

结果

本研究表明,每百万人口的病例数最高的是欧洲,而非洲的新病例趋势最低。不同大陆的死亡率如下:北美 4.57%、欧洲 3.74%、南美 3.87%、非洲 3.49%、大洋洲和亚洲不到 2%。线性回归分析表明,医院床位、国内生产总值、糖尿病和较高的平均年龄是不同大陆死亡率的重要危险因素。自 COVID-19 首例病例至 2021 年 1 月 1 日的预测分析表明,2020 年底的最坏情景预测每日新增病例范围为 0 至 30 万,每日新增死亡人数范围为 0 至 1.6 万。

结论

应更好地定义 COVID-19 的流行病学和临床特征,因为它们在未来控制这一大流行的策略中可以发挥重要作用。

https://cdn.ncbi.nlm.nih.gov/pmc/blobs/581c/8157209/9e3541d7566b/ijerph-18-05350-g005.jpg
https://cdn.ncbi.nlm.nih.gov/pmc/blobs/581c/8157209/ca92ddeb8d58/ijerph-18-05350-g001.jpg
https://cdn.ncbi.nlm.nih.gov/pmc/blobs/581c/8157209/66e5816dd510/ijerph-18-05350-g002.jpg
https://cdn.ncbi.nlm.nih.gov/pmc/blobs/581c/8157209/d2d2edfae6a0/ijerph-18-05350-g003.jpg
https://cdn.ncbi.nlm.nih.gov/pmc/blobs/581c/8157209/a16563d12310/ijerph-18-05350-g004.jpg
https://cdn.ncbi.nlm.nih.gov/pmc/blobs/581c/8157209/9e3541d7566b/ijerph-18-05350-g005.jpg

相似文献

1
Continent-Wide Analysis of COVID 19: Total Cases, Deaths, Tests, Socio-Economic, and Morbidity Factors Associated to the Mortality Rate, and Forecasting Analysis in 2020-2021.全球范围内的 COVID-19 分析:与死亡率相关的总病例、死亡、检测、社会经济和发病率因素,以及 2020-2021 年的预测分析。
Int J Environ Res Public Health. 2021 May 18;18(10):5350. doi: 10.3390/ijerph18105350.
2
Forecasting fully vaccinated people against COVID-19 and examining future vaccination rate for herd immunity in the US, Asia, Europe, Africa, South America, and the World.预测美国、亚洲、欧洲、非洲、南美洲及全球范围内完全接种新冠疫苗的人数,并研究未来实现群体免疫所需的疫苗接种率。
Appl Soft Comput. 2021 Nov;111:107708. doi: 10.1016/j.asoc.2021.107708. Epub 2021 Jul 14.
3
Prediction of the COVID-19 Pandemic for the Top 15 Affected Countries: Advanced Autoregressive Integrated Moving Average (ARIMA) Model.预测受 COVID-19 影响最严重的 15 个国家:高级自回归综合移动平均 (ARIMA) 模型。
JMIR Public Health Surveill. 2020 May 13;6(2):e19115. doi: 10.2196/19115.
4
COVID-19 Pandemic: Evaluation of Socio-Economic Impact on Aesthetic Plastic Surgery Providers.COVID-19 大流行:对美容整形外科医生的社会经济影响评估。
Aesthetic Plast Surg. 2021 Aug;45(4):1877-1887. doi: 10.1007/s00266-021-02130-9. Epub 2021 Apr 8.
5
[Analysis of the development trend and severity of the COVID-19 panidemic in the global world].[全球新冠疫情的发展趋势与严重程度分析]
Beijing Da Xue Xue Bao Yi Xue Ban. 2021 Jun 18;53(3):536-542. doi: 10.19723/j.issn.1671-167X.2021.03.016.
6
Forecasting the daily deaths caused by COVID-19 using ARIMA model.利用 ARIMA 模型预测 COVID-19 每日死亡人数。
Pak J Pharm Sci. 2022 Jan;35(1):141-149.
7
Spatiotemporal visualization for the global COVID-19 surveillance by balloon chart.气球图进行全球 COVID-19 监测的时空可视化。
Infect Dis Poverty. 2021 Mar 1;10(1):21. doi: 10.1186/s40249-021-00800-z.
8
Forecasting the Spreading of COVID-19 across Nine Countries from Europe, Asia, and the American Continents Using the ARIMA Models.使用自回归积分滑动平均(ARIMA)模型预测新冠病毒在欧洲、亚洲和美洲九个国家的传播情况。
Microorganisms. 2020 Jul 30;8(8):1158. doi: 10.3390/microorganisms8081158.
9
Molecular evolution of SARS-CoV-2 from December 2019 to August 2022.SARS-CoV-2 的分子进化:2019 年 12 月至 2022 年 8 月。
J Med Virol. 2023 Jan;95(1):e28366. doi: 10.1002/jmv.28366.
10
Estimation of COVID-19 prevalence in Italy, Spain, and France.估算意大利、西班牙和法国的 COVID-19 流行率。
Sci Total Environ. 2020 Aug 10;729:138817. doi: 10.1016/j.scitotenv.2020.138817. Epub 2020 Apr 22.

引用本文的文献

1
COVID-19 vaccine uptake in individuals with functional difficulty, disability, and comorbid conditions: insights from a national survey in Bangladesh.功能障碍、残疾和合并症个体的 COVID-19 疫苗接种率:来自孟加拉国全国调查的见解。
BMC Public Health. 2024 Sep 17;24(1):2531. doi: 10.1186/s12889-024-20096-6.
2
Relationship between family function and anxiety among nurses during the COVID-19 pandemic: a mediating role of expressive suppression.新冠疫情期间护士家庭功能与焦虑的关系:表达抑制的中介作用
BMC Nurs. 2024 Jul 29;23(1):508. doi: 10.1186/s12912-024-02167-6.
3
Time to SARS-CoV-2 clearance in African, Caucasian, and Asian ethnic groups.

本文引用的文献

1
Predictive performance of international COVID-19 mortality forecasting models.国际 COVID-19 死亡率预测模型的预测性能。
Nat Commun. 2021 May 10;12(1):2609. doi: 10.1038/s41467-021-22457-w.
2
Air Pollution and Covid-19: The Role of Particulate Matter in the Spread and Increase of Covid-19's Morbidity and Mortality.空气污染与新冠疫情:颗粒物在新冠病毒传播和致死率增加中的作用
Int J Environ Res Public Health. 2020 Jun 22;17(12):4487. doi: 10.3390/ijerph17124487.
3
Prevalence of Sars-Cov-2 Infection in Health Workers (HWs) and Diagnostic Test Performance: The Experience of a Teaching Hospital in Central Italy.
SARS-CoV-2 清除时间在非裔、白人和亚裔族群中的差异。
Influenza Other Respir Viruses. 2024 Jun;18(6):e13238. doi: 10.1111/irv.13238.
4
Lessons learnt from the first wave of COVID-19 in Damascus, Syria: a multicentre retrospective cohort study.叙利亚大马士革首例 COVID-19 浪潮的经验教训:一项多中心回顾性队列研究。
BMJ Open. 2023 Jul 20;13(7):e065280. doi: 10.1136/bmjopen-2022-065280.
5
COVID-19 outcomes in people living with HIV: Peering through the waves.HIV 感染者的 COVID-19 结局:洞察疫情变化。
Clinics (Sao Paulo). 2023 May 25;78:100223. doi: 10.1016/j.clinsp.2023.100223. eCollection 2023.
6
Exploring the impact of the pandemic on the relationship between individual types and the natural environment: .探索疫情对个体类型与自然环境之间关系的影响:
Curr Res Ecol Soc Psychol. 2023;4:100096. doi: 10.1016/j.cresp.2023.100096. Epub 2023 Mar 12.
7
Nesting the SIRV model with NAR, LSTM and statistical methods to fit and predict COVID-19 epidemic trend in Africa.将 SIRV 模型与 NAR、LSTM 和统计方法嵌套,以拟合和预测非洲的 COVID-19 疫情趋势。
BMC Public Health. 2023 Jan 19;23(1):138. doi: 10.1186/s12889-023-14992-6.
8
Social Factors as Major Determinants of Rural Development Variation for Predicting Epidemic Vulnerability: A Lesson for the Future.社会因素是农村发展变化预测传染病脆弱性的主要决定因素:未来的教训。
Int J Environ Res Public Health. 2022 Oct 27;19(21):13977. doi: 10.3390/ijerph192113977.
9
An in-depth statistical analysis of the COVID-19 pandemic's initial spread in the WHO African region.对世卫组织非洲区域 COVID-19 大流行初始传播的深入统计分析。
BMJ Glob Health. 2022 Apr;7(4). doi: 10.1136/bmjgh-2021-007295.
10
COVID-19 Vaccine Boosters: The Good, the Bad, and the Ugly.新冠疫苗加强针:好处、坏处与隐患
Vaccines (Basel). 2021 Nov 9;9(11):1299. doi: 10.3390/vaccines9111299.
意大利中部一所教学医院的卫生工作者(HWs)中 SARS-CoV-2 感染的流行率和诊断检测性能。
Int J Environ Res Public Health. 2020 Jun 19;17(12):4417. doi: 10.3390/ijerph17124417.
4
Systematic Review of Clinical Insights into Novel Coronavirus (CoVID-19) Pandemic: Persisting Challenges in U.S. Rural Population.新型冠状病毒(COVID-19)大流行的临床洞察系统评价:美国农村人口的持续挑战。
Int J Environ Res Public Health. 2020 Jun 15;17(12):4279. doi: 10.3390/ijerph17124279.
5
COVID-19: A global public health disaster.新冠疫情:一场全球公共卫生灾难。
Int J Health Sci (Qassim). 2020 May-Jun;14(3):7-8.
6
Time Series Analysis and Forecast of the COVID-19 Pandemic in India using Genetic Programming.基于遗传规划的印度新冠肺炎疫情时间序列分析与预测
Chaos Solitons Fractals. 2020 Sep;138:109945. doi: 10.1016/j.chaos.2020.109945. Epub 2020 May 30.
7
Coronavirus disease 2019 (COVID-19): A literature review.新型冠状病毒病 2019(COVID-19):文献综述。
J Infect Public Health. 2020 May;13(5):667-673. doi: 10.1016/j.jiph.2020.03.019. Epub 2020 Apr 8.
8
Is temperature reducing the transmission of COVID-19 ?温度是否会降低新冠病毒的传播?
Environ Res. 2020 Jul;186:109553. doi: 10.1016/j.envres.2020.109553. Epub 2020 Apr 18.
9
COVID-19 virus outbreak forecasting of registered and recovered cases after sixty day lockdown in Italy: A data driven model approach.意大利封锁 60 天后,对确诊和治愈病例的 COVID-19 病毒爆发预测:基于数据驱动的模型方法。
J Microbiol Immunol Infect. 2020 Jun;53(3):396-403. doi: 10.1016/j.jmii.2020.04.004. Epub 2020 Apr 13.
10
Correlation between weather and Covid-19 pandemic in Jakarta, Indonesia.印度尼西亚雅加达的天气与新冠疫情的相关性
Sci Total Environ. 2020 Jul 10;725:138436. doi: 10.1016/j.scitotenv.2020.138436. Epub 2020 Apr 4.