• 文献检索
  • 文档翻译
  • 深度研究
  • 学术资讯
  • Suppr Zotero 插件Zotero 插件
  • 邀请有礼
  • 套餐&价格
  • 历史记录
应用&插件
Suppr Zotero 插件Zotero 插件浏览器插件Mac 客户端Windows 客户端微信小程序
定价
高级版会员购买积分包购买API积分包
服务
文献检索文档翻译深度研究API 文档MCP 服务
关于我们
关于 Suppr公司介绍联系我们用户协议隐私条款
关注我们

Suppr 超能文献

核心技术专利:CN118964589B侵权必究
粤ICP备2023148730 号-1Suppr @ 2026

文献检索

告别复杂PubMed语法,用中文像聊天一样搜索,搜遍4000万医学文献。AI智能推荐,让科研检索更轻松。

立即免费搜索

文件翻译

保留排版,准确专业,支持PDF/Word/PPT等文件格式,支持 12+语言互译。

免费翻译文档

深度研究

AI帮你快速写综述,25分钟生成高质量综述,智能提取关键信息,辅助科研写作。

立即免费体验

新冠疫情对洛杉矶及华盛顿特区/巴尔的摩都会区一氧化碳排放的影响

The Impact of COVID-19 on CO Emissions in the Los Angeles and Washington DC/Baltimore Metropolitan Areas.

作者信息

Yadav Vineet, Ghosh Subhomoy, Mueller Kimberly, Karion Anna, Roest Geoffrey, Gourdji Sharon M, Lopez-Coto Israel, Gurney Kevin R, Parazoo Nicholas, Verhulst Kristal R, Kim Jooil, Prinzivalli Steve, Fain Clayton, Nehrkorn Thomas, Mountain Marikate, Keeling Ralph F, Weiss Ray F, Duren Riley, Miller Charles E, Whetstone James

机构信息

Jet Propulsion Laboratory California Institute of Technology Pasadena CA USA.

Center for Research Computing University of Notre Dame South Bend IN USA.

出版信息

Geophys Res Lett. 2021 Jun 16;48(11):e2021GL092744. doi: 10.1029/2021GL092744. Epub 2021 Jun 7.

DOI:10.1029/2021GL092744
PMID:34149111
原文链接:https://pmc.ncbi.nlm.nih.gov/articles/PMC8206775/
Abstract

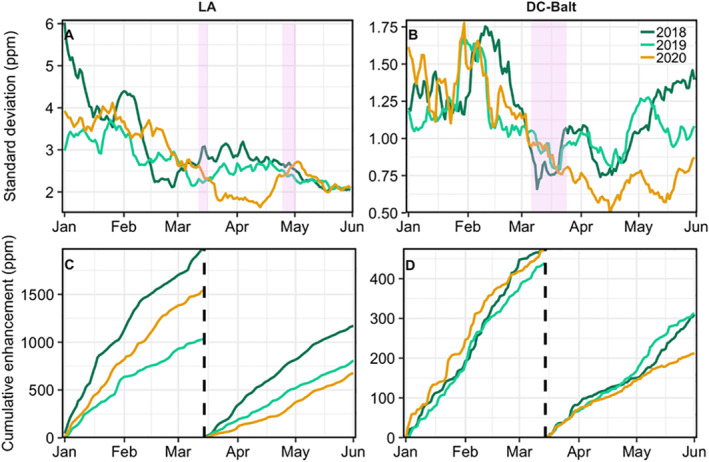
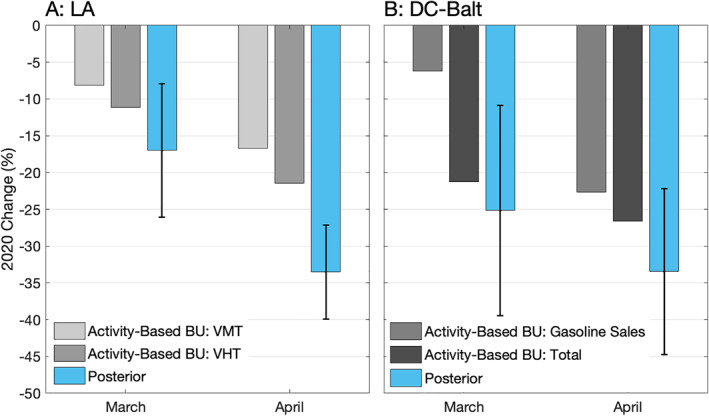
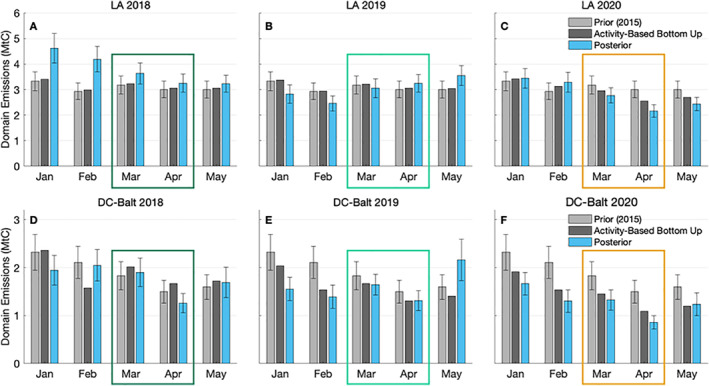
Responses to COVID-19 have resulted in unintended reductions of city-scale carbon dioxide (CO) emissions. Here, we detect and estimate decreases in CO emissions in Los Angeles and Washington DC/Baltimore during March and April 2020. We present three lines of evidence using methods that have increasing model dependency, including an inverse model to estimate relative emissions changes in 2020 compared to 2018 and 2019. The March decrease (25%) in Washington DC/Baltimore is largely supported by a drop in natural gas consumption associated with a warm spring whereas the decrease in April (33%) correlates with changes in gasoline fuel sales. In contrast, only a fraction of the March (17%) and April (34%) reduction in Los Angeles is explained by traffic declines. Methods and measurements used herein highlight the advantages of atmospheric CO observations for providing timely insights into rapidly changing emissions patterns that can empower cities to course-correct CO reduction activities efficiently.

摘要

对新冠疫情的应对措施意外导致了城市规模的二氧化碳(CO)排放量减少。在此,我们检测并估算了2020年3月和4月洛杉矶以及华盛顿特区/巴尔的摩的CO排放量下降情况。我们使用了模型依赖性逐渐增强的方法提供三条证据线索,其中包括一个反演模型,用于估算2020年相较于2018年和2019年的相对排放变化。华盛顿特区/巴尔的摩3月的排放量下降(25%)在很大程度上是由于暖春导致天然气消费量下降,而4月的下降(33%)与汽油燃料销售变化相关。相比之下,洛杉矶3月(17%)和4月(34%)排放量的减少仅有一小部分可归因于交通量下降。本文所使用的方法和测量结果凸显了大气CO观测的优势,即能及时洞察迅速变化的排放模式,从而使城市能够高效地对CO减排活动进行调整。

https://cdn.ncbi.nlm.nih.gov/pmc/blobs/5e68/8206775/66dbd5fdf674/GRL-48-e2021GL092744-g003.jpg
https://cdn.ncbi.nlm.nih.gov/pmc/blobs/5e68/8206775/5b80c19f5bde/GRL-48-e2021GL092744-g002.jpg
https://cdn.ncbi.nlm.nih.gov/pmc/blobs/5e68/8206775/9b6ab2fb2fdf/GRL-48-e2021GL092744-g001.jpg
https://cdn.ncbi.nlm.nih.gov/pmc/blobs/5e68/8206775/66dbd5fdf674/GRL-48-e2021GL092744-g003.jpg
https://cdn.ncbi.nlm.nih.gov/pmc/blobs/5e68/8206775/5b80c19f5bde/GRL-48-e2021GL092744-g002.jpg
https://cdn.ncbi.nlm.nih.gov/pmc/blobs/5e68/8206775/9b6ab2fb2fdf/GRL-48-e2021GL092744-g001.jpg
https://cdn.ncbi.nlm.nih.gov/pmc/blobs/5e68/8206775/66dbd5fdf674/GRL-48-e2021GL092744-g003.jpg

相似文献

1
The Impact of COVID-19 on CO Emissions in the Los Angeles and Washington DC/Baltimore Metropolitan Areas.新冠疫情对洛杉矶及华盛顿特区/巴尔的摩都会区一氧化碳排放的影响
Geophys Res Lett. 2021 Jun 16;48(11):e2021GL092744. doi: 10.1029/2021GL092744. Epub 2021 Jun 7.
2
Wintertime CO, CH, and CO Emissions Estimation for the Washington, DC-Baltimore Metropolitan Area Using an Inverse Modeling Technique.利用反演建模技术估算华盛顿特区-巴尔的摩都会区冬季一氧化碳、碳氢化合物和一氧化碳排放量。
Environ Sci Technol. 2020 Mar 3;54(5):2606-2614. doi: 10.1021/acs.est.9b06619. Epub 2020 Feb 21.
3
Carbon Monoxide Emissions from the Washington, DC, and Baltimore Metropolitan Area: Recent Trend and COVID-19 Anomaly.华盛顿特区和巴尔的摩大都市区的一氧化碳排放:近期趋势和 COVID-19 异常。
Environ Sci Technol. 2022 Feb 15;56(4):2172-2180. doi: 10.1021/acs.est.1c06288. Epub 2022 Jan 26.
4
Seasonally Resolved Excess Urban Methane Emissions from the Baltimore/Washington, DC Metropolitan Region.季节分辨巴尔的摩/华盛顿都会区过量人为甲烷排放。
Environ Sci Technol. 2019 Oct 1;53(19):11285-11293. doi: 10.1021/acs.est.9b02782. Epub 2019 Sep 19.
5
Real-World Vehicle Emissions Characterization for the Shing Mun Tunnel in Hong Kong and Fort McHenry Tunnel in the United States.香港城门隧道和美国麦克亨利堡隧道的实际车辆排放特征
Res Rep Health Eff Inst. 2019 Mar;2019(199):5-52.
6
Large and seasonally varying biospheric CO fluxes in the Los Angeles megacity revealed by atmospheric radiocarbon.大气放射性碳揭示了洛杉矶大都市区中大量且季节性变化的生物圈 CO 通量。
Proc Natl Acad Sci U S A. 2020 Oct 27;117(43):26681-26687. doi: 10.1073/pnas.2005253117. Epub 2020 Oct 12.
7
Assessing the Effectiveness of an Urban CO Monitoring Network over the Paris Region through the COVID-19 Lockdown Natural Experiment.评估 COVID-19 封锁期间巴黎地区城市 CO 监测网络的有效性:自然实验研究
Environ Sci Technol. 2022 Feb 15;56(4):2153-2162. doi: 10.1021/acs.est.1c04973. Epub 2022 Jan 26.
8
Methane Emissions Show Recent Decline but Strong Seasonality in Two US Northeastern Cities.甲烷排放显示美国两个东北部城市近期呈下降趋势,但季节性很强。
Environ Sci Technol. 2023 Dec 5;57(48):19565-19574. doi: 10.1021/acs.est.3c05050. Epub 2023 Nov 9.
9
Informing urban climate planning with high resolution data: the Hestia fossil fuel CO emissions for Baltimore, Maryland.利用高分辨率数据为城市气候规划提供信息:马里兰州巴尔的摩市的赫斯提亚化石燃料二氧化碳排放量。
Carbon Balance Manag. 2020 Oct 14;15(1):22. doi: 10.1186/s13021-020-00157-0.
10
Fluxes of Atmospheric Greenhouse-Gases in Maryland (FLAGG-MD): Emissions of Carbon Dioxide in the Baltimore, MD-Washington, D.C. area.马里兰州大气温室气体通量研究(FLAGG-MD):马里兰州巴尔的摩市与华盛顿特区地区的二氧化碳排放情况
J Geophys Res Atmos. 2020;125(9). doi: https://doi.org/10.1029/2019jd032004.

引用本文的文献

1
Scaling Urban Methane Emissions: Utility of Single-Site Measurements in Five Urban Domains.量化城市甲烷排放:五个城市区域单点测量的效用
Environ Sci Technol. 2025 Jul 22;59(28):14399-14409. doi: 10.1021/acs.est.5c03844. Epub 2025 Jul 9.
2
Reductions in California's Urban Fossil Fuel CO Emissions During the COVID-19 Pandemic.新冠疫情期间加利福尼亚州城市化石燃料一氧化碳排放量的减少
AGU Adv. 2022 Dec;3(6):e2022AV000732. doi: 10.1029/2022AV000732. Epub 2022 Dec 1.
3
Observing Anthropogenic and Biogenic CO Emissions in Los Angeles Using a Dense Sensor Network.

本文引用的文献

1
Background conditions for an urban greenhouse gas network in the Washington, D.C. and Baltimore metropolitan region.华盛顿特区和巴尔的摩大都市区城市温室气体网络的背景条件。
Atmos Chem Phys. 2021;21(8). doi: 10.5194/acp-21-6257-2021.
2
Satellite-based estimates of decline and rebound in China's CO emissions during COVID-19 pandemic.基于卫星的中国 COVID-19 大流行期间 CO 排放量下降和反弹的估算。
Sci Adv. 2020 Dec 2;6(49). doi: 10.1126/sciadv.abd4998. Print 2020 Dec.
3
The Vulcan Version 3.0 High-Resolution Fossil Fuel CO Emissions for the United States.
利用密集传感器网络观测洛杉矶的人为和生物源一氧化碳排放。
Environ Sci Technol. 2025 Feb 25;59(7):3508-3517. doi: 10.1021/acs.est.4c11392. Epub 2025 Feb 13.
4
Sustained Reductions of Bay Area CO Emissions 2018-2022.2018-2022 年湾区 CO 排放量持续减少。
Environ Sci Technol. 2024 Apr 16;58(15):6586-6594. doi: 10.1021/acs.est.3c09642. Epub 2024 Apr 4.
5
Methane Emissions Show Recent Decline but Strong Seasonality in Two US Northeastern Cities.甲烷排放显示美国两个东北部城市近期呈下降趋势,但季节性很强。
Environ Sci Technol. 2023 Dec 5;57(48):19565-19574. doi: 10.1021/acs.est.3c05050. Epub 2023 Nov 9.
6
From political pledges to quantitative mapping of climate mitigation plans: Comparison of two European cities.从政治承诺到气候缓解计划的量化映射:两个欧洲城市的比较。
Carbon Balance Manag. 2023 Sep 6;18(1):18. doi: 10.1186/s13021-023-00236-y.
7
Decadal decrease in Los Angeles methane emissions is much smaller than bottom-up estimates.洛杉矶甲烷排放量的十年降幅远小于自下而上的估计值。
Nat Commun. 2023 Sep 2;14(1):5353. doi: 10.1038/s41467-023-40964-w.
8
The Impact of COVID-19 Outbreak on CO Emissions in the Ten Countries with the Highest Carbon Dioxide Emissions.新冠疫情对二氧化碳排放量最高的十个国家的一氧化碳排放量的影响。
J Environ Public Health. 2023 Jun 13;2023:4605206. doi: 10.1155/2023/4605206. eCollection 2023.
9
Inferred vehicular emissions at a near-road site: Impacts of COVID-19 restrictions, traffic patterns, and ambient air temperature.近道路站点的推断车辆排放:新冠疫情限制措施、交通模式和环境空气温度的影响
Atmos Environ (1994). 2023 Apr 15;299:119649. doi: 10.1016/j.atmosenv.2023.119649. Epub 2023 Feb 11.
10
Short run "rebound effect" of COVID on the transport carbon footprint.新冠疫情对交通碳足迹的短期“反弹效应”。
Cities. 2022 Dec;131:104039. doi: 10.1016/j.cities.2022.104039. Epub 2022 Oct 18.
美国的“瓦肯3.0版”高分辨率化石燃料一氧化碳排放
J Geophys Res Atmos. 2020 Oct 16;125(19):e2020JD032974. doi: 10.1029/2020JD032974. Epub 2020 Oct 5.
4
Greenhouse gas observations from the Northeast Corridor tower network.来自东北走廊塔楼网络的温室气体观测数据。
Earth Syst Sci Data. 2020;12(1). doi: https://doi.org/10.5194/essd-12-699-2020.
5
Near-real-time monitoring of global CO emissions reveals the effects of the COVID-19 pandemic.近实时全球 CO 排放监测揭示了 COVID-19 大流行的影响。
Nat Commun. 2020 Oct 14;11(1):5172. doi: 10.1038/s41467-020-18922-7.
6
Large and seasonally varying biospheric CO fluxes in the Los Angeles megacity revealed by atmospheric radiocarbon.大气放射性碳揭示了洛杉矶大都市区中大量且季节性变化的生物圈 CO 通量。
Proc Natl Acad Sci U S A. 2020 Oct 27;117(43):26681-26687. doi: 10.1073/pnas.2005253117. Epub 2020 Oct 12.
7
Statistical characterization of urban CO emission signals observed by commercial airliner measurements.利用商业客机测量观测到的城市 CO 排放信号的统计特征描述。
Sci Rep. 2020 May 14;10(1):7963. doi: 10.1038/s41598-020-64769-9.
8
Intercomparison of atmospheric trace gas dispersion models: Barnett Shale case study.大气痕量气体扩散模型的相互比较: Barnett 页岩案例研究。
Atmos Chem Phys. 2019;19. doi: 10.5194/acp-19-2561-2019.
9
Carbon dioxide and methane measurements from the Los Angeles Megacity Carbon Project - Part 1: calibration, urban enhancements, and uncertainty estimates.洛杉矶特大城市碳项目的二氧化碳和甲烷测量——第1部分:校准、城市增强及不确定性估计
Atmos Chem Phys. 2017;17. doi: 10.5194/acp-17-8313-2017.
10
Anthropogenic and biogenic CO fluxes in the Boston urban region.人为源和生物源 CO 在波士顿城区的通量。
Proc Natl Acad Sci U S A. 2018 Jul 17;115(29):7491-7496. doi: 10.1073/pnas.1803715115. Epub 2018 Jul 2.