Department of Geography, University of California, Santa Barbara, CA 93106;
Climate Hazards Center, University of California, Santa Barbara, CA 93106.
Proc Natl Acad Sci U S A. 2021 Oct 12;118(41). doi: 10.1073/pnas.2024792118.
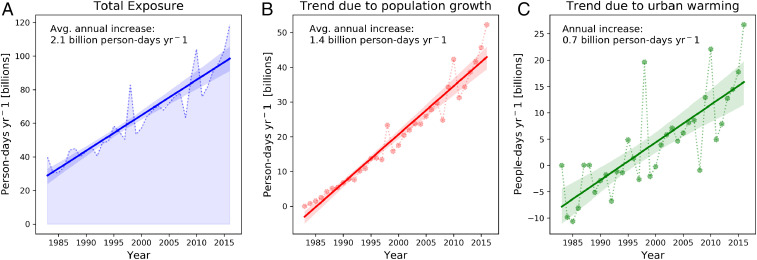
Increased exposure to extreme heat from both climate change and the urban heat island effect-total urban warming-threatens the sustainability of rapidly growing urban settlements worldwide. Extreme heat exposure is highly unequal and severely impacts the urban poor. While previous studies have quantified global exposure to extreme heat, the lack of a globally accurate, fine-resolution temporal analysis of urban exposure crucially limits our ability to deploy adaptations. Here, we estimate daily urban population exposure to extreme heat for 13,115 urban settlements from 1983 to 2016. We harmonize global, fine-resolution (0.05°), daily temperature maxima and relative humidity estimates with geolocated and longitudinal global urban population data. We measure the average annual rate of increase in exposure (person-days/year) at the global, regional, national, and municipality levels, separating the contribution to exposure trajectories from urban population growth versus total urban warming. Using a daily maximum wet bulb globe temperature threshold of 30 °C, global exposure increased nearly 200% from 1983 to 2016. Total urban warming elevated the annual increase in exposure by 52% compared to urban population growth alone. Exposure trajectories increased for 46% of urban settlements, which together in 2016 comprised 23% of the planet's population (1.7 billion people). However, how total urban warming and population growth drove exposure trajectories is spatially heterogeneous. This study reinforces the importance of employing multiple extreme heat exposure metrics to identify local patterns and compare exposure trends across geographies. Our results suggest that previous research underestimates extreme heat exposure, highlighting the urgency for targeted adaptations and early warning systems to reduce harm from urban extreme heat exposure.
由于气候变化和城市热岛效应导致的极端高温暴露的增加——总城市变暖——威胁着全球快速增长的城市住区的可持续性。极端高温暴露极不平等,严重影响城市贫困人口。虽然以前的研究已经量化了全球对极端高温的暴露,但缺乏对城市暴露的全球准确、精细分辨率的时间分析,严重限制了我们部署适应措施的能力。在这里,我们估计了 1983 年至 2016 年 13115 个城市住区每天的城市人口暴露于极端高温的情况。我们将全球、精细分辨率(0.05°)、每日最高温度和相对湿度估计与地理位置和纵向全球城市人口数据进行协调。我们测量了全球、区域、国家和直辖市各级暴露的平均年增长率(人/年),将城市人口增长与总城市变暖对暴露轨迹的贡献分开。使用每日最高湿球温度阈值 30°C,全球暴露量从 1983 年到 2016 年几乎增加了 200%。与城市人口增长单独相比,总城市变暖使暴露的年增长率增加了 52%。暴露轨迹增加了 46%的城市住区,2016 年这些住区占地球人口的 23%(17 亿人)。然而,总城市变暖与人口增长如何驱动暴露轨迹在空间上是不均匀的。这项研究强调了使用多种极端高温暴露指标来识别当地模式和比较地理区域的暴露趋势的重要性。我们的研究结果表明,以前的研究低估了极端高温暴露,这凸显了针对城市极端高温暴露采取有针对性的适应措施和早期预警系统的紧迫性,以减少危害。