• 文献检索
  • 文档翻译
  • 深度研究
  • 学术资讯
  • Suppr Zotero 插件Zotero 插件
  • 邀请有礼
  • 套餐&价格
  • 历史记录
应用&插件
Suppr Zotero 插件Zotero 插件浏览器插件Mac 客户端Windows 客户端微信小程序
定价
高级版会员购买积分包购买API积分包
服务
文献检索文档翻译深度研究API 文档MCP 服务
关于我们
关于 Suppr公司介绍联系我们用户协议隐私条款
关注我们

Suppr 超能文献

核心技术专利:CN118964589B侵权必究
粤ICP备2023148730 号-1Suppr @ 2026

文献检索

告别复杂PubMed语法,用中文像聊天一样搜索,搜遍4000万医学文献。AI智能推荐,让科研检索更轻松。

立即免费搜索

文件翻译

保留排版,准确专业,支持PDF/Word/PPT等文件格式,支持 12+语言互译。

免费翻译文档

深度研究

AI帮你快速写综述,25分钟生成高质量综述,智能提取关键信息,辅助科研写作。

立即免费体验

中国江淮流域梅雨对电力系统排放影响的评估

Assessment of plum rain's impact on power system emissions in Yangtze-Huaihe River basin of China.

作者信息

Pan Guangsheng, Hu Qinran, Gu Wei, Ding Shixing, Qiu Haifeng, Lu Yuping

机构信息

School of Electrical Engineering, Southeast University, Nanjing, China, 210096.

School of Cyber Science and Engineering, Southeast University, Nanjing, China, 210096.

出版信息

Nat Commun. 2021 Oct 25;12(1):6156. doi: 10.1038/s41467-021-26358-w.

DOI:10.1038/s41467-021-26358-w
PMID:34697311
原文链接:https://pmc.ncbi.nlm.nih.gov/articles/PMC8545941/
Abstract

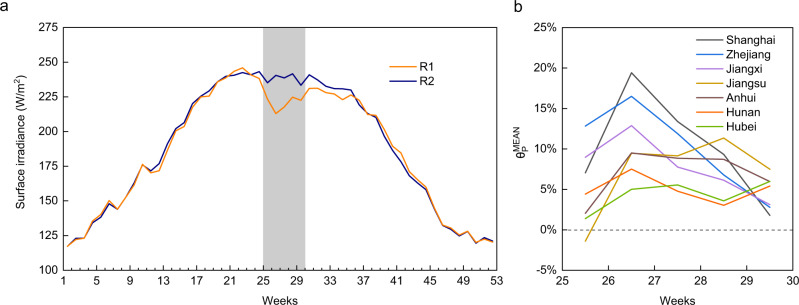
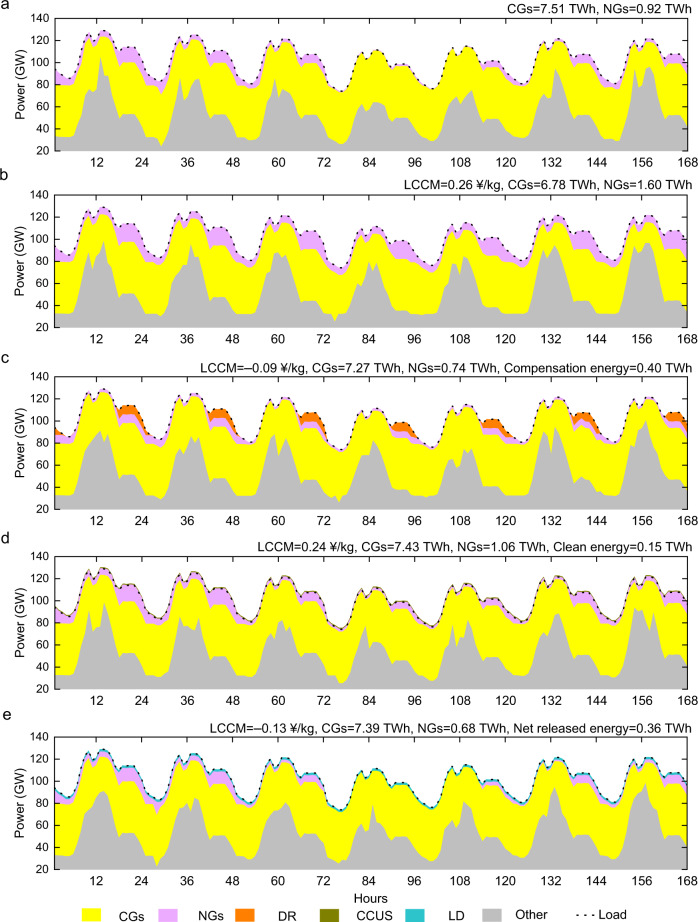
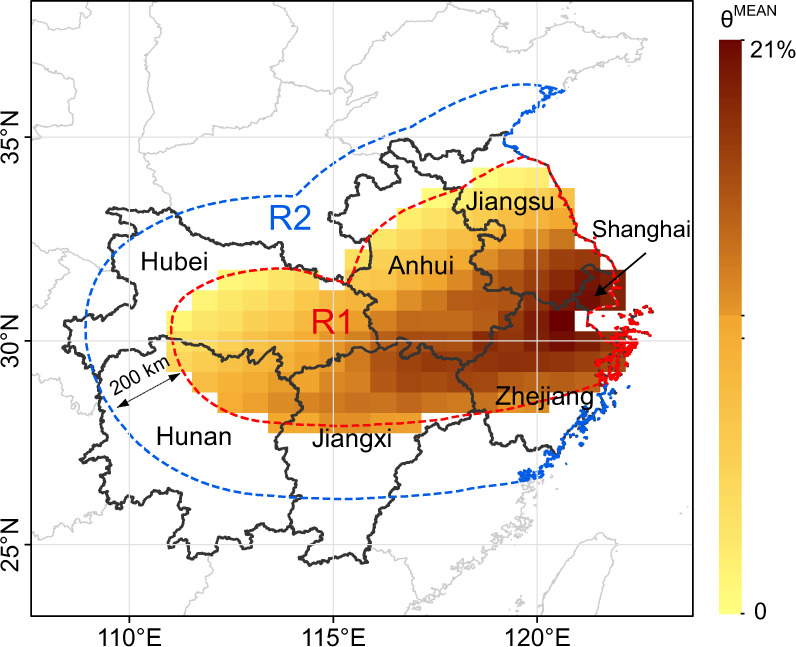
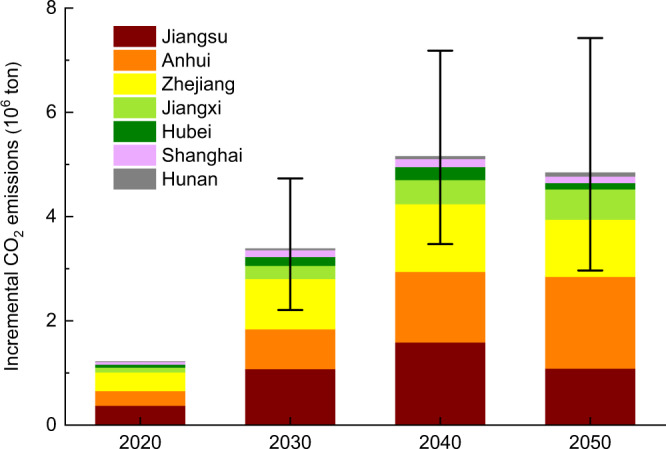
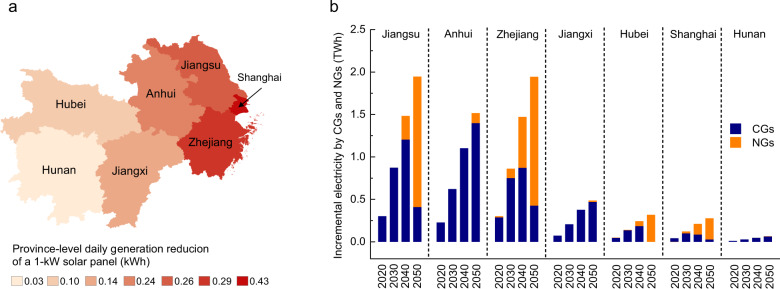
As a typical climate that occurs in the Yangtze-Huaihe River basin of China with a size of 500,000 km, plum rain can reduce the photovoltaic (PV) potential by lowering the surface irradiance (SI) in the affected region. Based on hourly meteorological data from 1980 to 2020, we find that plum rain can lower the SI in the affected region with a weekly peak drop of more than 20% at the most affected locations. This SI drop, coupled with a large number of deployed PV systems, can cause incremental CO emissions (ICEs) of local power systems by increasing the additional thermal power. Using a cost optimization model, we demonstrate that the ICEs in 2020 already reached 1.22 megatons and could range from 2.21 to 4.73 megatons, 3.47 to 7.19 megatons, and 2.97 to 7.43 megatons in 2030, 2040, and 2050, respectively, considering a change trend interval of a ±25% fluctuation in power generation and demand in the different years. To offset these ICEs, we compare four pathways integrated with promising technologies. This analysis reveals that the advanced deployment of complementary technologies can improve the PV utilization level to address climate impacts.

摘要

梅雨是中国长江淮河流域出现的一种典型气候,影响范围达50万平方公里,它会降低受影响地区的地面辐照度(SI),从而降低光伏发电潜力。基于1980年至2020年的逐小时气象数据,我们发现梅雨会降低受影响地区的地面辐照度,在受影响最严重的地点,每周峰值降幅超过20%。这种地面辐照度的下降,再加上大量已部署的光伏系统,会通过增加额外的火力发电量,导致当地电力系统的增量碳排放(ICEs)。使用成本优化模型,我们证明,考虑到不同年份发电和需求±25%波动的变化趋势区间,2020年的增量碳排放已达到122万吨,2030年、2040年和2050年分别可能在221万至473万吨、347万至719万吨和297万至743万吨之间。为了抵消这些增量碳排放,我们比较了与有前景的技术相结合的四种途径。该分析表明,互补技术的先进部署可以提高光伏发电利用水平,以应对气候影响。

https://cdn.ncbi.nlm.nih.gov/pmc/blobs/739b/8545941/871f1e3de113/41467_2021_26358_Fig6_HTML.jpg
https://cdn.ncbi.nlm.nih.gov/pmc/blobs/739b/8545941/e7d67180d492/41467_2021_26358_Fig1_HTML.jpg
https://cdn.ncbi.nlm.nih.gov/pmc/blobs/739b/8545941/2d273dcfc364/41467_2021_26358_Fig2_HTML.jpg
https://cdn.ncbi.nlm.nih.gov/pmc/blobs/739b/8545941/7e84558ea7b5/41467_2021_26358_Fig3_HTML.jpg
https://cdn.ncbi.nlm.nih.gov/pmc/blobs/739b/8545941/1d0146815f20/41467_2021_26358_Fig4_HTML.jpg
https://cdn.ncbi.nlm.nih.gov/pmc/blobs/739b/8545941/243f43c546b8/41467_2021_26358_Fig5_HTML.jpg
https://cdn.ncbi.nlm.nih.gov/pmc/blobs/739b/8545941/871f1e3de113/41467_2021_26358_Fig6_HTML.jpg

相似文献

1
Assessment of plum rain's impact on power system emissions in Yangtze-Huaihe River basin of China.中国江淮流域梅雨对电力系统排放影响的评估
Nat Commun. 2021 Oct 25;12(1):6156. doi: 10.1038/s41467-021-26358-w.
2
Temporal and spatial characteristics of the water pollutant concentration in Huaihe River Basin from 2003 to 2012, China.2003年至2012年中国淮河流域水污染物浓度的时空特征
Environ Monit Assess. 2016 Sep;188(9):522. doi: 10.1007/s10661-016-5503-0. Epub 2016 Aug 16.
3
Hydrological impacts of precipitation extremes in the Huaihe River Basin, China.中国淮河流域极端降水的水文影响。
Springerplus. 2016 Oct 6;5(1):1731. doi: 10.1186/s40064-016-3429-1. eCollection 2016.
4
The gap of water supply-Demand and its driving factors: From water footprint view in Huaihe River Basin.供需水缺口及其驱动因素:基于淮河流域水足迹视角
PLoS One. 2021 Mar 4;16(3):e0247604. doi: 10.1371/journal.pone.0247604. eCollection 2021.
5
The influence of stagnant and transport types weather on heavy pollution in the Yangtze-Huaihe valley, China.停滞和传输类型天气对中国长江-淮河流域重污染的影响。
Sci Total Environ. 2021 Oct 20;792:148393. doi: 10.1016/j.scitotenv.2021.148393. Epub 2021 Jun 16.
6
Assessing natural and anthropogenic influences on water discharge and sediment load in the Yangtze River, China.评估中国长江径流量和输沙量的自然及人为影响。
Sci Total Environ. 2017 Dec 31;607-608:920-932. doi: 10.1016/j.scitotenv.2017.07.002. Epub 2017 Jul 27.
7
Increasing carbon storage in subtropical forests over the Yangtze River basin and its relations to the major ecological projects.增加长江流域亚热带森林的碳储量及其与主要生态工程的关系。
Sci Total Environ. 2020 Mar 20;709:136163. doi: 10.1016/j.scitotenv.2019.136163. Epub 2019 Dec 18.
8
Revealing Water Stress by the Thermal Power Industry in China Based on a High Spatial Resolution Water Withdrawal and Consumption Inventory.基于高空间分辨率取用水与耗水核算的中国火力发电耗水足迹研究
Environ Sci Technol. 2016 Feb 16;50(4):1642-52. doi: 10.1021/acs.est.5b05374. Epub 2016 Feb 3.
9
[Coupling coordination measurement of urbanization and eco-environment system in Huaihe River Basin of China based on fuzzy matter element theory].基于模糊物元理论的中国淮河流域城市化与生态环境系统耦合协调度测度
Ying Yong Sheng Tai Xue Bao. 2013 May;24(5):1244-52.
10
Trends in the occurrence and risk assessment of antibiotics in shallow lakes in the lower-middle reaches of the Yangtze River basin, China.中国长江中下游流域浅水湖泊中抗生素的发生和风险评估趋势。
Ecotoxicol Environ Saf. 2019 Nov 15;183:109511. doi: 10.1016/j.ecoenv.2019.109511. Epub 2019 Aug 3.

引用本文的文献

1
Economic and environmental competitiveness of multiple hydrogen production pathways in China.中国多种制氢途径的经济与环境竞争力
Nat Commun. 2025 May 8;16(1):4284. doi: 10.1038/s41467-025-59412-y.
2
Climate change impacts on the extreme power shortage events of wind-solar supply systems worldwide during 1980-2022.气候变化对1980 - 2022年全球范围内风能太阳能供应系统的极端电力短缺事件的影响。
Nat Commun. 2024 Jun 18;15(1):5225. doi: 10.1038/s41467-024-48966-y.
3
Towards the prospect of carbon-neutral power system 2060: A Power-Meteorology-Society systematic view.

本文引用的文献

1
Power sector investment implications of climate impacts on renewable resources in Latin America and the Caribbean.拉丁美洲和加勒比地区可再生资源受气候影响对能源部门投资的意义。
Nat Commun. 2021 Feb 24;12(1):1276. doi: 10.1038/s41467-021-21502-y.
2
Exploring the trade-offs between electric heating policy and carbon mitigation in China.探讨中国电采暖政策与碳减排之间的权衡。
Nat Commun. 2020 Nov 27;11(1):6054. doi: 10.1038/s41467-020-19854-y.
3
India's potential for integrating solar and on- and offshore wind power into its energy system.
迈向2060年碳中和电力系统的前景:电力-气象-社会系统视角。
Heliyon. 2024 Mar 11;10(6):e27970. doi: 10.1016/j.heliyon.2024.e27970. eCollection 2024 Mar 30.
印度将太阳能、陆上和海上风电整合到其能源系统中的潜力。
Nat Commun. 2020 Sep 21;11(1):4750. doi: 10.1038/s41467-020-18318-7.
4
Offshore wind: An opportunity for cost-competitive decarbonization of China's energy economy.海上风电:中国能源经济实现具有成本竞争力的脱碳的机遇。
Sci Adv. 2020 Feb 21;6(8):eaax9571. doi: 10.1126/sciadv.aax9571. eCollection 2020 Feb.
5
The Modern-Era Retrospective Analysis for Research and Applications, Version 2 (MERRA-2).现代时代研究与应用回顾分析第2版(MERRA-2)
J Clim. 2017 Jun 20;Volume 30(Iss 13):5419-5454. doi: 10.1175/JCLI-D-16-0758.1.
6
The role of energy storage in deep decarbonization of electricity production.储能在电力生产深度脱碳中的作用。
Nat Commun. 2019 Jul 30;10(1):3413. doi: 10.1038/s41467-019-11161-5.
7
Amplification of future energy demand growth due to climate change.气候变化导致未来能源需求增长加剧。
Nat Commun. 2019 Jun 24;10(1):2762. doi: 10.1038/s41467-019-10399-3.
8
Secular decrease of wind power potential in India associated with warming in the Indian Ocean.与印度洋变暖相关的印度风力发电潜力的长期下降。
Sci Adv. 2018 Dec 5;4(12):eaat5256. doi: 10.1126/sciadv.aat5256. eCollection 2018 Dec.