• 文献检索
  • 文档翻译
  • 深度研究
  • 学术资讯
  • Suppr Zotero 插件Zotero 插件
  • 邀请有礼
  • 套餐&价格
  • 历史记录
应用&插件
Suppr Zotero 插件Zotero 插件浏览器插件Mac 客户端Windows 客户端微信小程序
定价
高级版会员购买积分包购买API积分包
服务
文献检索文档翻译深度研究API 文档MCP 服务
关于我们
关于 Suppr公司介绍联系我们用户协议隐私条款
关注我们

Suppr 超能文献

核心技术专利:CN118964589B侵权必究
粤ICP备2023148730 号-1Suppr @ 2026

文献检索

告别复杂PubMed语法,用中文像聊天一样搜索,搜遍4000万医学文献。AI智能推荐,让科研检索更轻松。

立即免费搜索

文件翻译

保留排版,准确专业,支持PDF/Word/PPT等文件格式,支持 12+语言互译。

免费翻译文档

深度研究

AI帮你快速写综述,25分钟生成高质量综述,智能提取关键信息,辅助科研写作。

立即免费体验

将易感-暴露-感染-清除(SEIR)模型扩展到处理 COVID-19 诊断测试的假阴性率和基于症状的管理:SEIR-fansy。

Extending the susceptible-exposed-infected-removed (SEIR) model to handle the false negative rate and symptom-based administration of COVID-19 diagnostic tests: SEIR-fansy.

机构信息

Department of Statistics, Harvard University, Cambridge, Massachusetts, USA.

Department of Biostatistics, University of Michigan, Ann Arbor, Michigan, United States.

出版信息

Stat Med. 2022 Jun 15;41(13):2317-2337. doi: 10.1002/sim.9357. Epub 2022 Feb 27.

DOI:10.1002/sim.9357
PMID:35224743
原文链接:https://pmc.ncbi.nlm.nih.gov/articles/PMC9035093/
Abstract

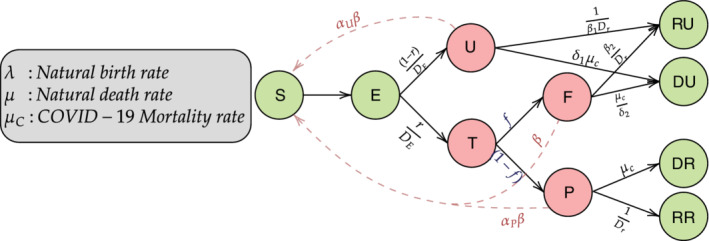
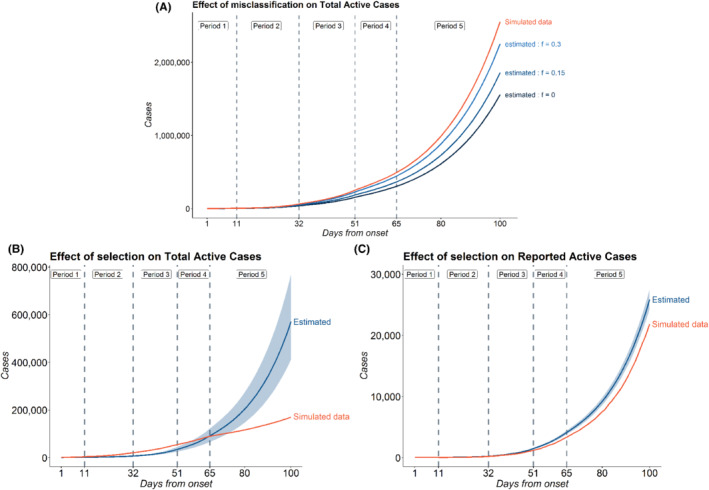
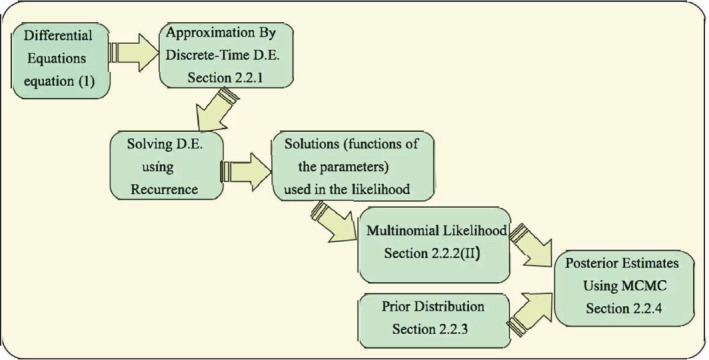
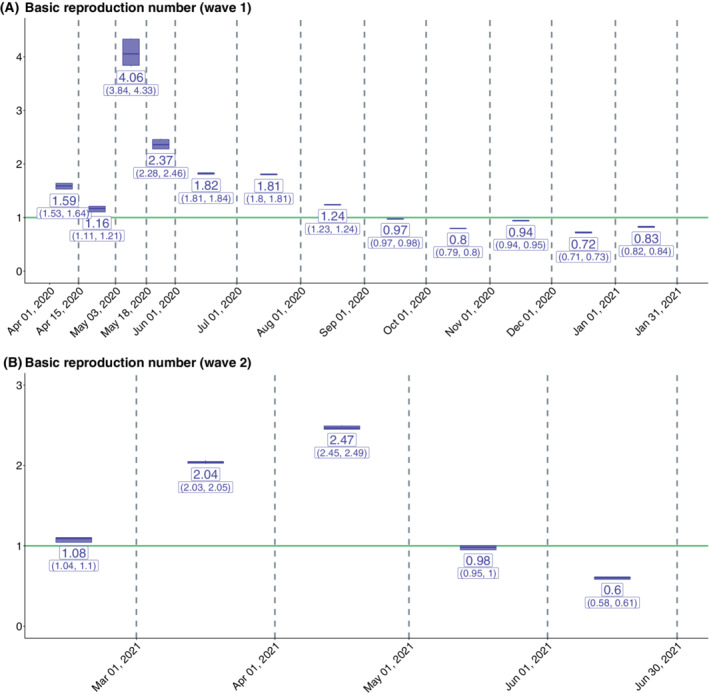
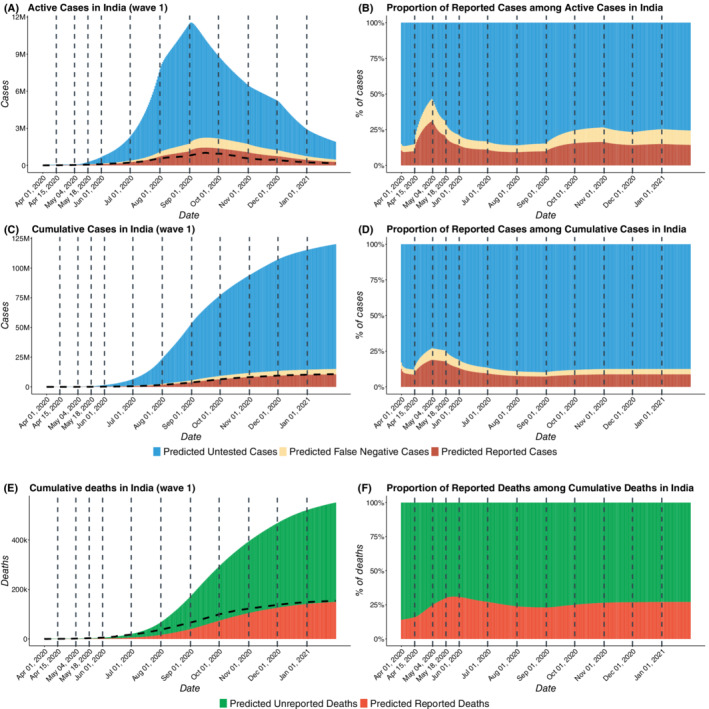
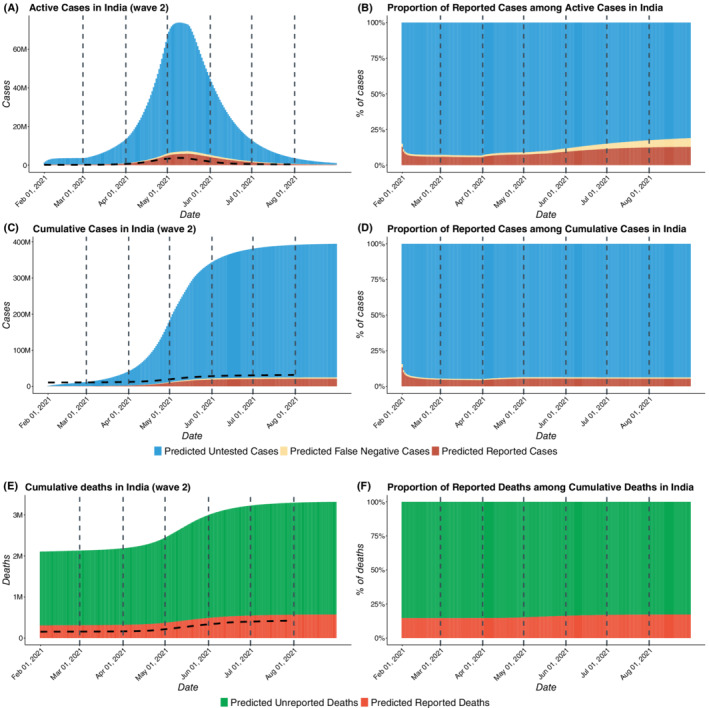
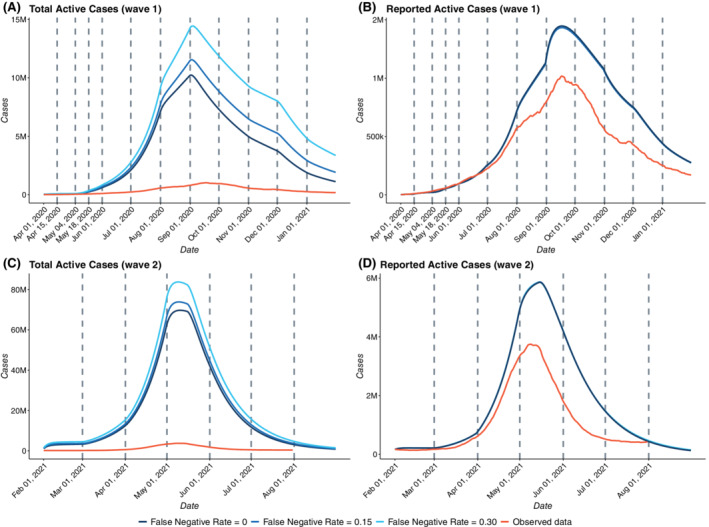
False negative rates of severe acute respiratory coronavirus 2 diagnostic tests, together with selection bias due to prioritized testing can result in inaccurate modeling of COVID-19 transmission dynamics based on reported "case" counts. We propose an extension of the widely used Susceptible-Exposed-Infected-Removed (SEIR) model that accounts for misclassification error and selection bias, and derive an analytic expression for the basic reproduction number as a function of false negative rates of the diagnostic tests and selection probabilities for getting tested. Analyzing data from the first two waves of the pandemic in India, we show that correcting for misclassification and selection leads to more accurate prediction in a test sample. We provide estimates of undetected infections and deaths between April 1, 2020 and August 31, 2021. At the end of the first wave in India, the estimated under-reporting factor for cases was at 11.1 (95% CI: 10.7,11.5) and for deaths at 3.58 (95% CI: 3.5,3.66) as of February 1, 2021, while they change to 19.2 (95% CI: 17.9, 19.9) and 4.55 (95% CI: 4.32, 4.68) as of July 1, 2021. Equivalently, 9.0% (95% CI: 8.7%, 9.3%) and 5.2% (95% CI: 5.0%, 5.6%) of total estimated infections were reported on these two dates, while 27.9% (95% CI: 27.3%, 28.6%) and 22% (95% CI: 21.4%, 23.1%) of estimated total deaths were reported. Extensive simulation studies demonstrate the effect of misclassification and selection on estimation of and prediction of future infections. A R-package SEIRfansy is developed for broader dissemination.

摘要

严重急性呼吸冠状病毒 2 诊断检测的假阴性率,加上由于优先检测而导致的选择偏差,可能会导致基于报告的“病例”数量对 COVID-19 传播动态进行不准确的建模。我们提出了一种广泛使用的易感-暴露-感染-清除(SEIR)模型的扩展,该模型考虑了分类错误和选择偏差,并推导出基本繁殖数作为诊断测试的假阴性率和检测选择概率的函数的解析表达式。分析印度大流行前两波的数据,我们表明,纠正分类错误和选择偏差可以在测试样本中进行更准确的预测。我们提供了 2020 年 4 月 1 日至 2021 年 8 月 31 日期间未检测到的感染和死亡的估计数。在印度第一波疫情结束时,截至 2021 年 2 月 1 日,病例的估计漏报因素为 11.1(95%置信区间:10.7,11.5),死亡的漏报因素为 3.58(95%置信区间:3.5,3.66),而到 2021 年 7 月 1 日,这些因素分别变为 19.2(95%置信区间:17.9,19.9)和 4.55(95%置信区间:4.32,4.68)。同样,在这两天报告的总估计感染中,9.0%(95%置信区间:8.7%,9.3%)和 5.2%(95%置信区间:5.0%,5.6%)是报告的,而 27.9%(95%置信区间:27.3%,28.6%)和 22%(95%置信区间:21.4%,23.1%)是报告的总死亡估计数。广泛的模拟研究表明了分类错误和选择对繁殖数估计和未来感染预测的影响。开发了一个用于更广泛传播的 R 包 SEIRfansy。

https://cdn.ncbi.nlm.nih.gov/pmc/blobs/563e/9111089/be7e2a4c06a6/SIM-41-2317-g004.jpg
https://cdn.ncbi.nlm.nih.gov/pmc/blobs/563e/9111089/eb5890f1e500/SIM-41-2317-g008.jpg
https://cdn.ncbi.nlm.nih.gov/pmc/blobs/563e/9111089/d168dcfeca87/SIM-41-2317-g001.jpg
https://cdn.ncbi.nlm.nih.gov/pmc/blobs/563e/9111089/01552e0b26ae/SIM-41-2317-g002.jpg
https://cdn.ncbi.nlm.nih.gov/pmc/blobs/563e/9111089/ee7169c32ad3/SIM-41-2317-g007.jpg
https://cdn.ncbi.nlm.nih.gov/pmc/blobs/563e/9111089/6e9789058608/SIM-41-2317-g006.jpg
https://cdn.ncbi.nlm.nih.gov/pmc/blobs/563e/9111089/0f36b61ff978/SIM-41-2317-g003.jpg
https://cdn.ncbi.nlm.nih.gov/pmc/blobs/563e/9111089/be7e2a4c06a6/SIM-41-2317-g004.jpg

相似文献

1
Extending the susceptible-exposed-infected-removed (SEIR) model to handle the false negative rate and symptom-based administration of COVID-19 diagnostic tests: SEIR-fansy.将易感-暴露-感染-清除(SEIR)模型扩展到处理 COVID-19 诊断测试的假阴性率和基于症状的管理:SEIR-fansy。
Stat Med. 2022 Jun 15;41(13):2317-2337. doi: 10.1002/sim.9357. Epub 2022 Feb 27.
2
EXTENDING THE SUSCEPTIBLE-EXPOSED-INFECTED-REMOVED(SEIR) MODEL TO HANDLE THE HIGH FALSE NEGATIVE RATE AND SYMPTOM-BASED ADMINISTRATION OF COVID-19 DIAGNOSTIC TESTS: SEIR-fansy.扩展易感-暴露-感染-康复(SEIR)模型以处理新冠病毒诊断测试的高假阴性率和基于症状的管理:SEIR-fansy
medRxiv. 2020 Sep 25:2020.09.24.20200238. doi: 10.1101/2020.09.24.20200238.
3
A comparison of five epidemiological models for transmission of SARS-CoV-2 in India.五种用于评估 SARS-CoV-2 在印度传播的流行病学模型比较。
BMC Infect Dis. 2021 Jun 7;21(1):533. doi: 10.1186/s12879-021-06077-9.
4
Estimation of the reproduction number and early prediction of the COVID-19 outbreak in India using a statistical computing approach.利用统计计算方法估计印度 COVID-19 爆发的繁殖数并进行早期预测。
Epidemiol Health. 2020;42:e2020028. doi: 10.4178/epih.e2020028. Epub 2020 May 9.
5
Incorporating false negative tests in epidemiological models for SARS-CoV-2 transmission and reconciling with seroprevalence estimates.将 SARS-CoV-2 传播的流行病学模型中的假阴性检测结果纳入并与血清阳性率估计值相协调。
Sci Rep. 2021 May 7;11(1):9748. doi: 10.1038/s41598-021-89127-1.
6
Estimating the wave 1 and wave 2 infection fatality rates from SARS-CoV-2 in India.估算印度 SARS-CoV-2 第 1 波和第 2 波的感染病死率。
BMC Res Notes. 2021 Jul 8;14(1):262. doi: 10.1186/s13104-021-05652-2.
7
Universal screening for SARS-CoV-2 infection: a rapid review.SARS-CoV-2 感染的普遍筛查:快速综述。
Cochrane Database Syst Rev. 2020 Sep 15;9(9):CD013718. doi: 10.1002/14651858.CD013718.
8
Covid-19 Outbreak Progression in Italian Regions: Approaching the Peak by the End of March in Northern Italy and First Week of April in Southern Italy.意大利各地区的新冠疫情进展:北部地区将于 3 月底达到高峰,南部地区将于 4 月初达到高峰。
Int J Environ Res Public Health. 2020 Apr 27;17(9):3025. doi: 10.3390/ijerph17093025.
9
Dynamics of SARS-CoV-2 Transmission Among Indian Nationals Evacuated From Iran.从伊朗撤离的印度公民中 SARS-CoV-2 传播的动态。
Disaster Med Public Health Prep. 2022 Apr;16(2):627-633. doi: 10.1017/dmp.2020.393. Epub 2020 Oct 22.
10
Epidemic Landscape and Forecasting of SARS-CoV-2 in India.印度 SARS-CoV-2 的疫情形势和预测。
J Epidemiol Glob Health. 2021 Mar;11(1):55-59. doi: 10.2991/jegh.k.200823.001. Epub 2020 Aug 28.

引用本文的文献

1
Discussion on "Regression Models for Understanding COVID-19 Epidemic Dynamics with Incomplete Data".关于“利用不完整数据理解新冠疫情动态的回归模型”的讨论
J Am Stat Assoc. 2021;116(536):1583-1586. doi: 10.1080/01621459.2021.1982721. Epub 2021 Dec 16.
2
Overcoming bias in estimating epidemiological parameters with realistic history-dependent disease spread dynamics.克服具有现实历史相关疾病传播动力学的流行病学参数估计中的偏差。
Nat Commun. 2024 Oct 9;15(1):8734. doi: 10.1038/s41467-024-53095-7.
3
Comparative impact assessment of COVID-19 policy interventions in five South Asian countries using reported and estimated unreported death counts during 2020-2021.

本文引用的文献

1
Estimating the Latent Period of Coronavirus Disease 2019 (COVID-19).估算 2019 年冠状病毒病(COVID-19)的潜伏期。
Clin Infect Dis. 2022 May 3;74(9):1678-1681. doi: 10.1093/cid/ciab746.
2
Estimating COVID-19‒ Related Mortality in India: An Epidemiological Challenge With Insufficient Data.估算印度新冠肺炎相关死亡率:数据不足带来的流行病学挑战
Am J Public Health. 2021 Jul;111(S2):S59-S62. doi: 10.2105/AJPH.2021.306419.
3
Estimating the wave 1 and wave 2 infection fatality rates from SARS-CoV-2 in India.估算印度 SARS-CoV-2 第 1 波和第 2 波的感染病死率。
2020 - 2021年期间,利用报告的和估计的未报告死亡人数对五个南亚国家新冠疫情政策干预措施进行的比较影响评估。
PLOS Glob Public Health. 2023 Dec 27;3(12):e0002063. doi: 10.1371/journal.pgph.0002063. eCollection 2023.
4
Uncovering associations between pre-existing conditions and COVID-19 Severity: A polygenic risk score approach across three large biobanks.揭示既往疾病与 COVID-19 严重程度之间的关联:三个大型生物库的多基因风险评分方法。
PLoS Genet. 2023 Dec 19;19(12):e1010907. doi: 10.1371/journal.pgen.1010907. eCollection 2023 Dec.
5
A mathematical model to assess the impact of testing and isolation compliance on the transmission of COVID-19.一个用于评估检测和隔离依从性对新冠病毒传播影响的数学模型。
Infect Dis Model. 2023 Jun;8(2):427-444. doi: 10.1016/j.idm.2023.04.005. Epub 2023 Apr 20.
6
Assessing the impact of non-pharmaceutical interventions (NPIs) and BCG vaccine cross-protection in the transmission dynamics of SARS-CoV-2 in eastern Africa.评估非药物干预(NPIs)和卡介苗疫苗交叉保护作用对东非地区 SARS-CoV-2 传播动力学的影响。
BMC Res Notes. 2022 Sep 4;15(1):283. doi: 10.1186/s13104-022-06171-4.
7
Modeling Global COVID-19 Dissemination Data After the Emergence of Omicron Variant Using Multipronged Approaches.采用多管齐下的方法对奥密克戎变异株出现后全球 COVID-19 传播数据进行建模。
Curr Microbiol. 2022 Aug 10;79(9):286. doi: 10.1007/s00284-022-02985-4.
8
Lessons from SARS-CoV-2 in India: A data-driven framework for pandemic resilience.印度新冠病毒的经验教训:一个基于数据的大流行应对框架。
Sci Adv. 2022 Jun 17;8(24):eabp8621. doi: 10.1126/sciadv.abp8621.
9
Using outbreak data to estimate the dynamic COVID-19 landscape in Eastern Africa.利用疫情数据估算东非地区 COVID-19 动态情况。
BMC Infect Dis. 2022 Jun 9;22(1):531. doi: 10.1186/s12879-022-07510-3.
10
A novel hybrid SEIQR model incorporating the effect of quarantine and lockdown regulations for COVID-19.一种新型混合 SEIQR 模型,纳入了 COVID-19 隔离和封锁措施的影响。
Sci Rep. 2021 Dec 15;11(1):24073. doi: 10.1038/s41598-021-03436-z.
BMC Res Notes. 2021 Jul 8;14(1):262. doi: 10.1186/s13104-021-05652-2.
4
A comparison of five epidemiological models for transmission of SARS-CoV-2 in India.五种用于评估 SARS-CoV-2 在印度传播的流行病学模型比较。
BMC Infect Dis. 2021 Jun 7;21(1):533. doi: 10.1186/s12879-021-06077-9.
5
Incorporating false negative tests in epidemiological models for SARS-CoV-2 transmission and reconciling with seroprevalence estimates.将 SARS-CoV-2 传播的流行病学模型中的假阴性检测结果纳入并与血清阳性率估计值相协调。
Sci Rep. 2021 May 7;11(1):9748. doi: 10.1038/s41598-021-89127-1.
6
COVID-19 serosurveys for public health decision making.用于公共卫生决策的新冠病毒血清学调查。
Lancet Glob Health. 2021 May;9(5):e559-e560. doi: 10.1016/S2214-109X(21)00057-7. Epub 2021 Mar 8.
7
False-negative results of initial RT-PCR assays for COVID-19: A systematic review.COVID-19 初始 RT-PCR 检测的假阴性结果:系统评价。
PLoS One. 2020 Dec 10;15(12):e0242958. doi: 10.1371/journal.pone.0242958. eCollection 2020.
8
Comparison of the SARS-CoV-2 Rapid antigen test to the real star Sars-CoV-2 RT PCR kit.比较 SARS-CoV-2 快速抗原检测与 real star SARS-CoV-2 RT-PCR 试剂盒。
J Virol Methods. 2021 Feb;288:114024. doi: 10.1016/j.jviromet.2020.114024. Epub 2020 Nov 20.
9
Collider bias undermines our understanding of COVID-19 disease risk and severity.撞击器偏差破坏了我们对 COVID-19 疾病风险和严重程度的理解。
Nat Commun. 2020 Nov 12;11(1):5749. doi: 10.1038/s41467-020-19478-2.
10
Statistical inference for association studies using electronic health records: handling both selection bias and outcome misclassification.基于电子健康记录的关联研究的统计推断:处理选择偏倚和结局错误分类。
Biometrics. 2022 Mar;78(1):214-226. doi: 10.1111/biom.13400. Epub 2020 Dec 3.