• 文献检索
  • 文档翻译
  • 深度研究
  • 学术资讯
  • Suppr Zotero 插件Zotero 插件
  • 邀请有礼
  • 套餐&价格
  • 历史记录
应用&插件
Suppr Zotero 插件Zotero 插件浏览器插件Mac 客户端Windows 客户端微信小程序
定价
高级版会员购买积分包购买API积分包
服务
文献检索文档翻译深度研究API 文档MCP 服务
关于我们
关于 Suppr公司介绍联系我们用户协议隐私条款
关注我们

Suppr 超能文献

核心技术专利:CN118964589B侵权必究
粤ICP备2023148730 号-1Suppr @ 2026

文献检索

告别复杂PubMed语法,用中文像聊天一样搜索,搜遍4000万医学文献。AI智能推荐,让科研检索更轻松。

立即免费搜索

文件翻译

保留排版,准确专业,支持PDF/Word/PPT等文件格式,支持 12+语言互译。

免费翻译文档

深度研究

AI帮你快速写综述,25分钟生成高质量综述,智能提取关键信息,辅助科研写作。

立即免费体验

新冠疫情封锁期间的环境故事:人类活动如何影响中国的细颗粒物(PM2.5)浓度?

The Environmental Story During the COVID-19 Lockdown: How Human Activities Affect PM2.5 Concentration in China?

作者信息

Tan Zhenyu, Li Xinghua, Gao Meiling, Jiang Liangcun

机构信息

College of Urban and Environmental SciencesNorthwest University Xi'an 710127 China.

School of Remote Sensing and Information EngineeringWuhan University Wuhan 430079 China.

出版信息

IEEE Geosci Remote Sens Lett. 2020 Dec 8;19:1001005. doi: 10.1109/LGRS.2020.3040435. eCollection 2022.

DOI:10.1109/LGRS.2020.3040435
PMID:35582473
原文链接:https://pmc.ncbi.nlm.nih.gov/articles/PMC8843045/
Abstract

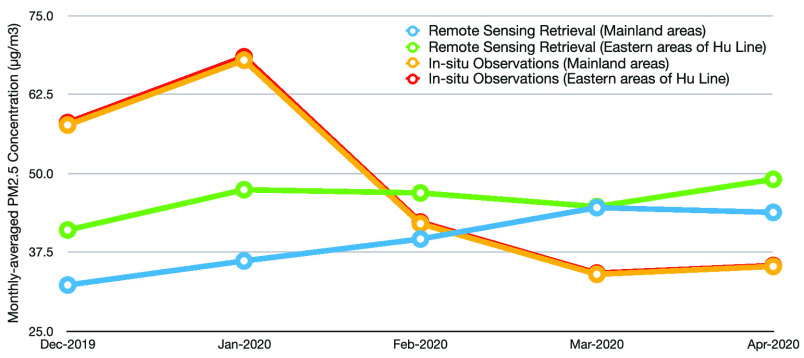
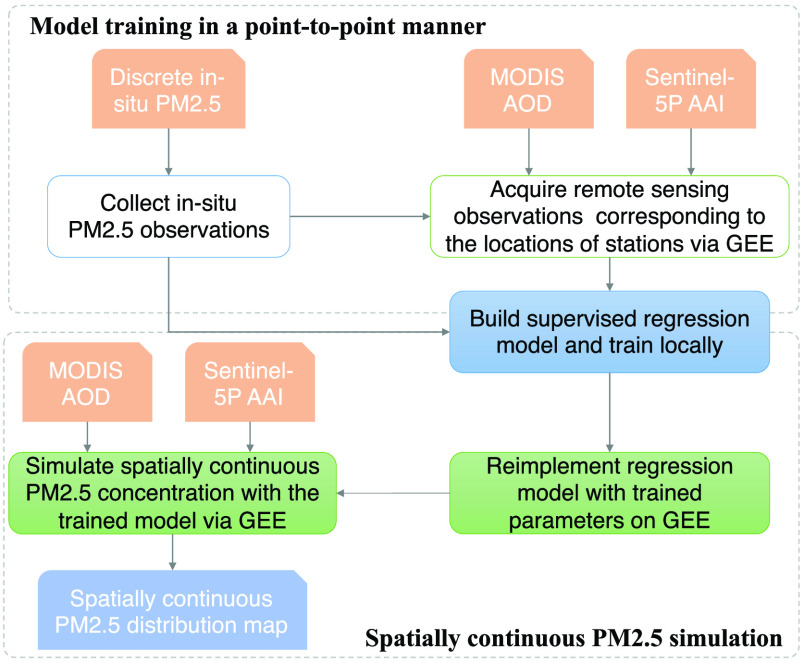
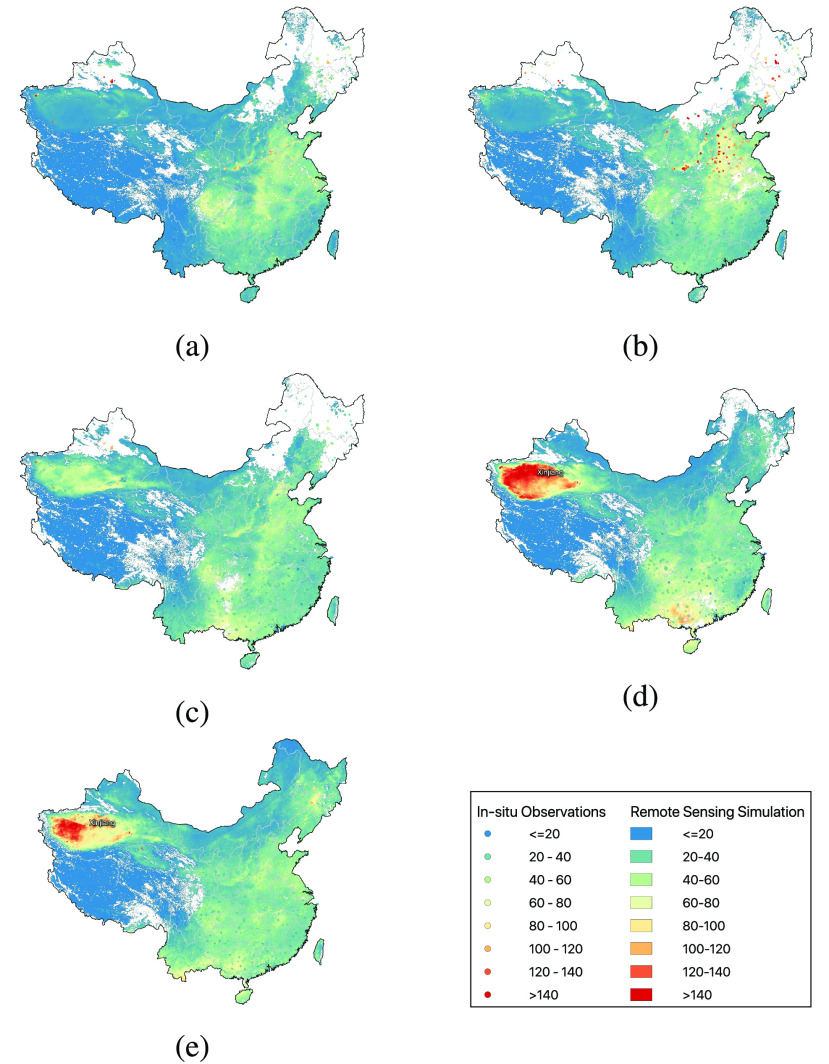
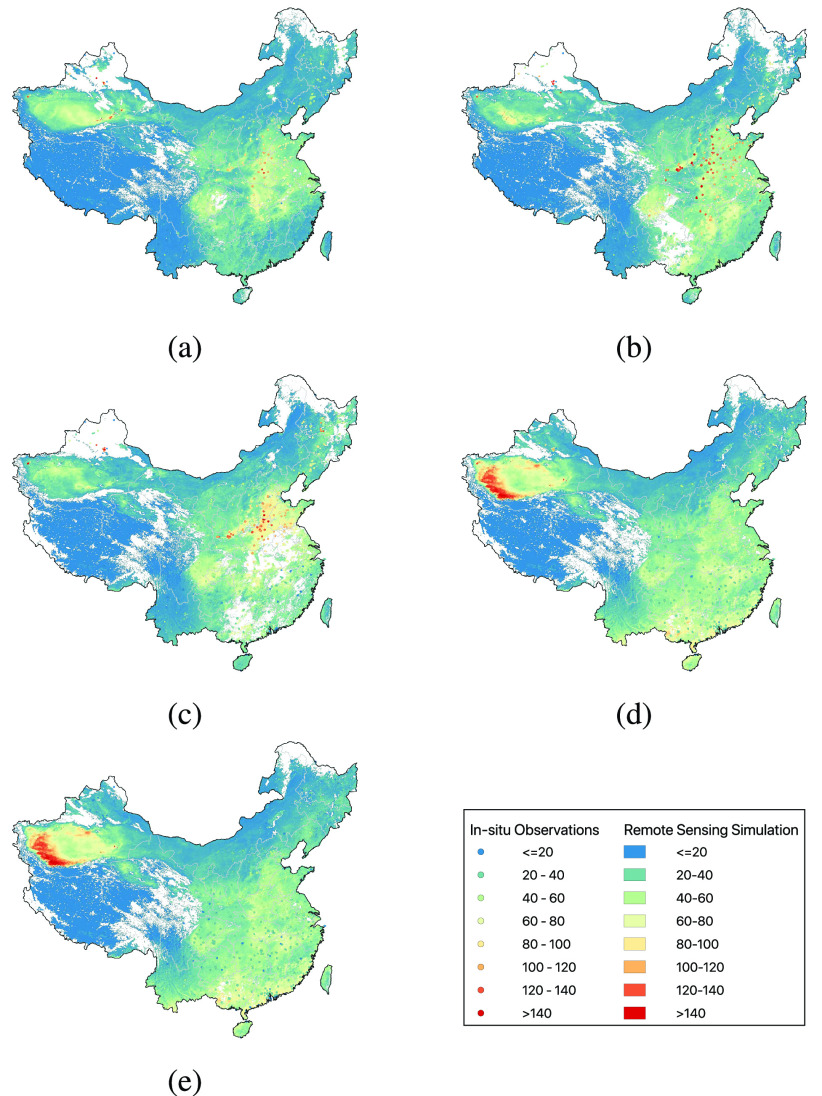
At the end of 2019, the very first COVID-19 coronavirus infection was reported and then it spread across the world just like wildfires. From late January to March 2020, most cities and villages in China were locked down, and consequently, human activities decreased dramatically. This letter presents an "offline learning and online inference" approach to explore the variation of PM2.5 pollution during this period. In the experiments, a deep regression model was trained to establish the complex relationship between remote sensing data and PM2.5 observations, and then the spatially continuous monthly PM2.5 distribution map was simulated using the Google Earth Engine platform. The results reveal that the COVID-19 lockdown truly decreased the PM2.5 pollution with certain hysteresis and the fine particle pollution begins to increase when advancing resumption of work and production gradually.

摘要

2019年底,首次报告了新型冠状病毒肺炎(COVID-19)冠状病毒感染病例,随后它如野火般在全球蔓延。从2020年1月下旬到3月,中国的大多数城乡都实施了封锁,因此人类活动大幅减少。本文提出了一种“离线学习与在线推理”方法,以探究这一时期细颗粒物(PM2.5)污染的变化情况。在实验中,训练了一个深度回归模型来建立遥感数据与PM2.5观测值之间的复杂关系,然后利用谷歌地球引擎平台模拟了空间连续的月度PM2.5分布图。结果表明,COVID-19封锁措施确实使PM2.5污染有所下降,但存在一定滞后性,随着复工复产的逐步推进,细颗粒物污染又开始增加。

https://cdn.ncbi.nlm.nih.gov/pmc/blobs/ea0b/8843045/dc59e4e918a8/li6-3040435.jpg
https://cdn.ncbi.nlm.nih.gov/pmc/blobs/ea0b/8843045/4e2bc9965ff4/li1-3040435.jpg
https://cdn.ncbi.nlm.nih.gov/pmc/blobs/ea0b/8843045/21598652827a/li2-3040435.jpg
https://cdn.ncbi.nlm.nih.gov/pmc/blobs/ea0b/8843045/b29307682ef9/li3ab-3040435.jpg
https://cdn.ncbi.nlm.nih.gov/pmc/blobs/ea0b/8843045/399fed6f48e1/li4abcde-3040435.jpg
https://cdn.ncbi.nlm.nih.gov/pmc/blobs/ea0b/8843045/39b31eaf1115/li5abcde-3040435.jpg
https://cdn.ncbi.nlm.nih.gov/pmc/blobs/ea0b/8843045/dc59e4e918a8/li6-3040435.jpg

相似文献

1
The Environmental Story During the COVID-19 Lockdown: How Human Activities Affect PM2.5 Concentration in China?新冠疫情封锁期间的环境故事:人类活动如何影响中国的细颗粒物(PM2.5)浓度?
IEEE Geosci Remote Sens Lett. 2020 Dec 8;19:1001005. doi: 10.1109/LGRS.2020.3040435. eCollection 2022.
2
Assessment and statistical modeling of the relationship between remotely sensed aerosol optical depth and PM2.5 in the eastern United States.美国东部地区遥感气溶胶光学厚度与PM2.5之间关系的评估及统计建模
Res Rep Health Eff Inst. 2012 May(167):5-83; discussion 85-91.
3
Spatiotemporal continuous estimates of PM concentrations in China, 2000-2016: A machine learning method with inputs from satellites, chemical transport model, and ground observations.2000-2016 年中国 PM 浓度的时空连续估算:卫星、化学输送模型和地面观测输入的机器学习方法。
Environ Int. 2019 Feb;123:345-357. doi: 10.1016/j.envint.2018.11.075. Epub 2018 Dec 18.
4
Predicting ground-level PM concentrations in the Beijing-Tianjin-Hebei region: A hybrid remote sensing and machine learning approach.预测京津冀地区的地面 PM 浓度:一种混合遥感和机器学习方法。
Environ Pollut. 2019 Jun;249:735-749. doi: 10.1016/j.envpol.2019.03.068. Epub 2019 Mar 22.
5
Google Earth Engine based spatio-temporal analysis of air pollutants before and during the first wave COVID-19 outbreak over Turkey via remote sensing.基于谷歌地球引擎,通过遥感对土耳其第一波新冠疫情爆发之前及期间的空气污染物进行时空分析。
J Clean Prod. 2021 Oct 15;319:128599. doi: 10.1016/j.jclepro.2021.128599. Epub 2021 Aug 14.
6
The relationships between PM and aerosol optical depth (AOD) in mainland China: About and behind the spatio-temporal variations.中国内地 PM 与气溶胶光学厚度(AOD)的关系:时空变化的背后和原因。
Environ Pollut. 2019 May;248:526-535. doi: 10.1016/j.envpol.2019.02.071. Epub 2019 Feb 25.
7
An interpretable self-adaptive deep neural network for estimating daily spatially-continuous PM concentrations across China.用于估算中国境内逐日空间连续 PM 浓度的可解释自适应深度神经网络。
Sci Total Environ. 2021 May 10;768:144724. doi: 10.1016/j.scitotenv.2020.144724. Epub 2021 Jan 5.
8
Combining Himawari-8 AOD and deep forest model to obtain city-level distribution of PM in China.利用 Himawari-8 AOD 和深度森林模型获取中国城市尺度的 PM 分布。
Environ Pollut. 2022 Mar 15;297:118826. doi: 10.1016/j.envpol.2022.118826. Epub 2022 Jan 8.
9
Unprecedented reduction in air pollution and corresponding short-term premature mortality associated with COVID-19 lockdown in Delhi, India.印度德里 COVID-19 封锁期间,空气污染前所未有减少,与之相关的短期过早死亡率也降低。
J Air Waste Manag Assoc. 2021 Sep;71(9):1085-1101. doi: 10.1080/10962247.2021.1905104. Epub 2021 Apr 15.
10
Impact of lockdown on particulate matter concentrations in Colombia during the COVID-19 pandemic.新冠疫情封锁措施对哥伦比亚颗粒物浓度的影响。
Sci Total Environ. 2021 Apr 10;764:142874. doi: 10.1016/j.scitotenv.2020.142874. Epub 2020 Oct 10.

引用本文的文献

1
Sources and Specified Health Risks of 12 PM-Bound Metals in a Typical Air-Polluted City in Northern China during the 13th Five-Year Plan.中国北方一个典型空气污染城市“十三五”期间中午时段空气中金属元素的来源及特定健康风险
Toxics. 2024 Aug 10;12(8):581. doi: 10.3390/toxics12080581.
2
Classifier Fusion for Detection of COVID-19 from CT Scans.基于CT扫描的COVID-19检测的分类器融合
Circuits Syst Signal Process. 2022;41(6):3397-3414. doi: 10.1007/s00034-021-01939-8. Epub 2022 Jan 3.
3
A review of GIS methodologies to analyze the dynamics of COVID-19 in the second half of 2020.

本文引用的文献

1
Decline in PM concentrations over major cities around the world associated with COVID-19.全球主要城市的 PM 浓度因 COVID-19 而下降。
Environ Res. 2020 Aug;187:109634. doi: 10.1016/j.envres.2020.109634. Epub 2020 May 5.
2
COVID-19 and Italy: what next?COVID-19 和意大利:下一步如何?
Lancet. 2020 Apr 11;395(10231):1225-1228. doi: 10.1016/S0140-6736(20)30627-9. Epub 2020 Mar 13.
3
Real estimates of mortality following COVID-19 infection.新冠病毒感染后死亡率的实际估计值。
2020年下半年用于分析新冠疫情动态的地理信息系统方法综述。
Trans GIS. 2021 Oct;25(5):2191-2239. doi: 10.1111/tgis.12792. Epub 2021 Jul 11.
Lancet Infect Dis. 2020 Jul;20(7):773. doi: 10.1016/S1473-3099(20)30195-X. Epub 2020 Mar 12.
4
COVID-19 and the cardiovascular system.新型冠状病毒肺炎与心血管系统。
Nat Rev Cardiol. 2020 May;17(5):259-260. doi: 10.1038/s41569-020-0360-5.
5
Epidemiological and clinical characteristics of 99 cases of 2019 novel coronavirus pneumonia in Wuhan, China: a descriptive study.中国武汉 99 例 2019 年新型冠状病毒肺炎患者的流行病学和临床特征:描述性研究。
Lancet. 2020 Feb 15;395(10223):507-513. doi: 10.1016/S0140-6736(20)30211-7. Epub 2020 Jan 30.
6
A Deep CNN-LSTM Model for Particulate Matter (PM) Forecasting in Smart Cities.基于深度学习的城市细颗粒物预测模型。
Sensors (Basel). 2018 Jul 10;18(7):2220. doi: 10.3390/s18072220.
7
Spatiotemporal characteristics of aerosols and their trends over mainland China with the recent Collection 6 MODIS and OMI satellite datasets.中国大陆气溶胶的时空特征及其随时间变化趋势,使用最新的 MODIS 集合 6 数据集和 OMI 卫星数据。
Environ Sci Pollut Res Int. 2018 Mar;25(7):6909-6927. doi: 10.1007/s11356-017-0715-6. Epub 2017 Dec 22.
8
Improving satellite-based PM estimates in China using Gaussian processes modeling in a Bayesian hierarchical setting.利用贝叶斯分层框架中的高斯过程建模改进中国基于卫星的 PM 估算。
Sci Rep. 2017 Aug 1;7(1):7048. doi: 10.1038/s41598-017-07478-0.
9
Health burden attributable to ambient PM in China.中国大气 PM 造成的健康负担。
Environ Pollut. 2017 Apr;223:575-586. doi: 10.1016/j.envpol.2017.01.060. Epub 2017 Feb 3.
10
Cause-specific premature death from ambient PM2.5 exposure in India: Estimate adjusted for baseline mortality.印度因暴露于环境细颗粒物(PM2.5)导致的特定病因过早死亡:针对基线死亡率进行调整后的估计值。
Environ Int. 2016 May;91:283-90. doi: 10.1016/j.envint.2016.03.004. Epub 2016 Mar 18.