Institute of Hypertension, Jiangsu Province Official Hospital, 30 Luojia Road, Nanjing, 210029, China.
BMC Geriatr. 2022 May 28;22(1):461. doi: 10.1186/s12877-022-03155-8.
To investigate the association between the triglyceride glucose (TyG) index and all-cause and cause-specific mortality in middle age and elderly population.
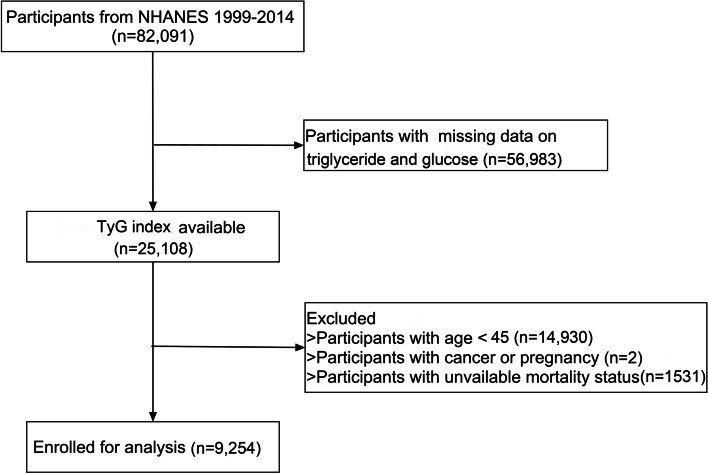
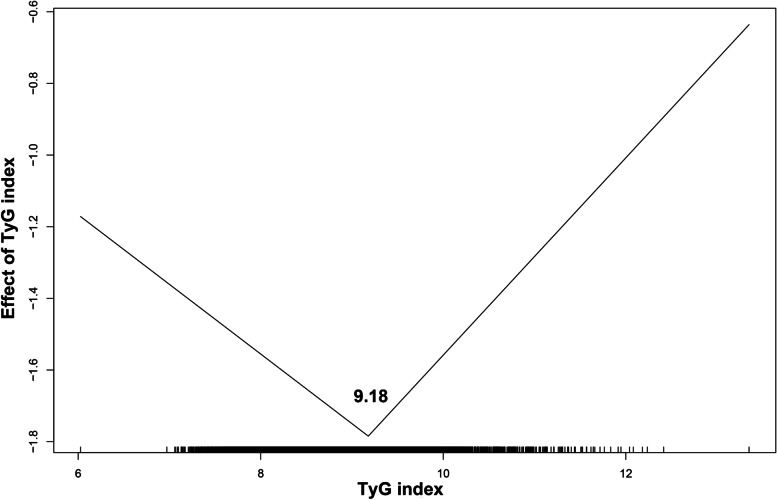
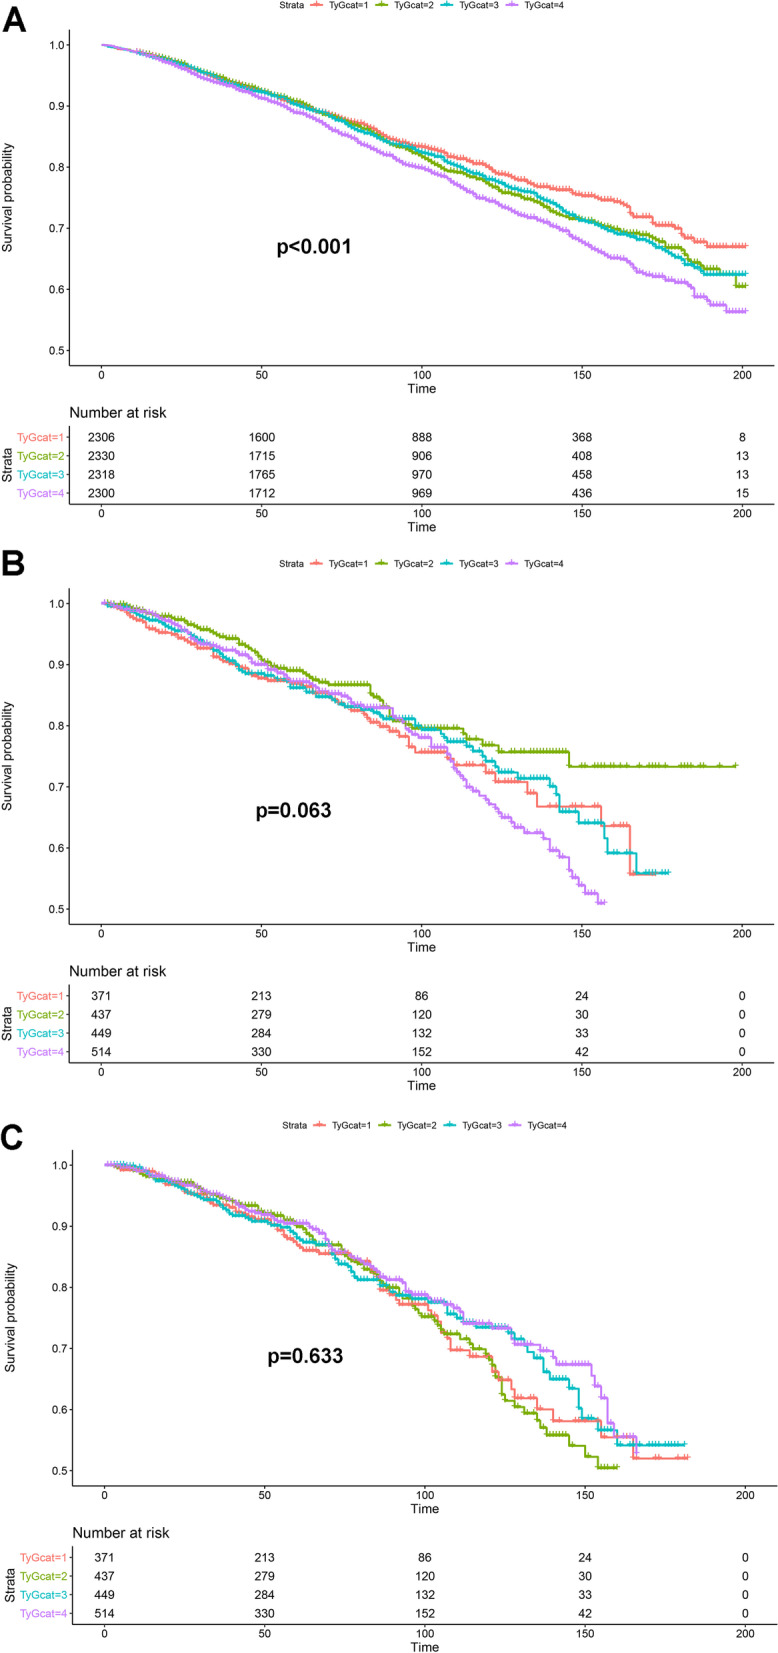
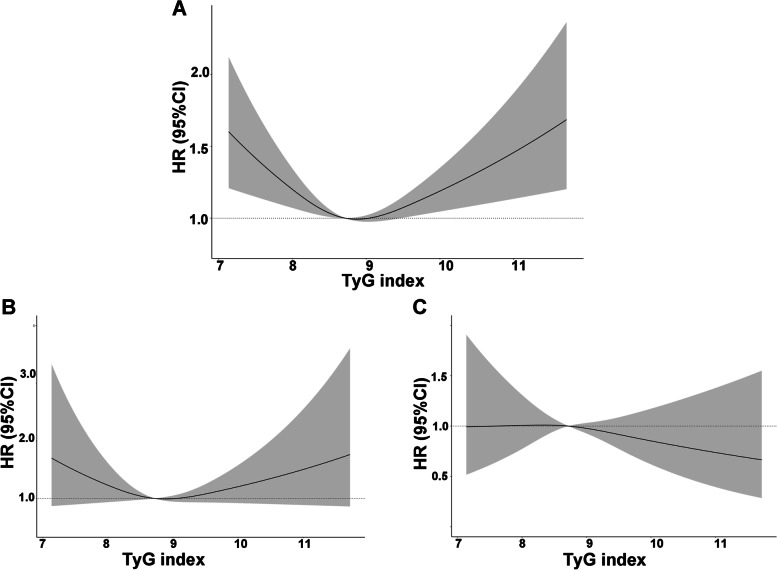
A total of 9,254 participants with age ≥ 45 years were enrolled from the National Health and Nutrition Examination Survey cycle of 1999-2014. The TyG index was determined as ln [fasting triglycerides (mg/dL) x fasting glucose (mg/dL)/2]. Primary outcomes were all-cause mortality and cause-specific mortality (cardiovascular diseases and malignant neoplasms). The association between the levels of TyG and the risk of mortality was explored with Cox regression models. After a median follow-up of 7.6 years, 1,774 all-cause death occurred. Univariate analysis showed that the TyG was associated with all-cause mortality (hazard ratio [HR] 1.18, 95% confidence interval [CI] [1.11,1.26]; p < 0.001). Furthermore, multivariate-adjusted analysis found that the third TyG quartile (8.72 ~ 9.16) was associated with the lowest risk of all-cause mortality (HR 0.84, 95%CI [0.73, 0.98]; p < 0.05). Restricted cubic splines showed that the association between levels of TyG index and the risk of all-cause mortality was non-linear (p for nonlinearity < 0.001) and the inflection point was 9.18 using threshold effect analysis. The HR was 0.82 (95%CI [0.71,0.96]) below 9.18 while the HR was 1.32 (95%CI [1.12,1.55]) above 9.18.
TyG index was U-shaped associated with all-cause mortality and the TyG index associated with the lowest risk of all-cause mortality was 9.18.
探讨甘油三酯-葡萄糖(TyG)指数与中年和老年人群全因死亡率和死因特异性死亡率的相关性。
本研究共纳入了 1999-2014 年国家健康和营养调查周期中年龄≥45 岁的 9254 名参与者。TyG 指数的计算方法为 ln[空腹甘油三酯(mg/dL)×空腹血糖(mg/dL)/2]。主要结局为全因死亡率和死因特异性死亡率(心血管疾病和恶性肿瘤)。采用 Cox 回归模型探讨 TyG 水平与死亡率风险之间的关系。经过中位数为 7.6 年的随访后,共发生 1774 例全因死亡。单因素分析显示,TyG 与全因死亡率相关(风险比[HR] 1.18,95%置信区间[CI] [1.11,1.26];p<0.001)。此外,多变量调整分析发现,TyG 的第三四分位数(8.72~9.16)与全因死亡率的风险最低相关(HR 0.84,95%CI [0.73,0.98];p<0.05)。限制三次样条显示,TyG 指数水平与全因死亡率风险之间的关系是非线性的(p 非线性<0.001),使用阈值效应分析,拐点为 9.18。HR 在 9.18 以下为 0.82(95%CI [0.71,0.96]),而 HR 在 9.18 以上为 1.32(95%CI [1.12,1.55])。
TyG 指数与全因死亡率呈 U 型相关,与全因死亡率风险最低相关的 TyG 指数为 9.18。