Qingdao Eye Hospital of Shandong First Medical University, Eye Institute of Shandong First Medical University, Qingdao, China.
State Key Laboratory Cultivation Base, Shandong Provincial Key Laboratory of Ophthalmology, Eye Institute of Shandong First Medical University, Qingdao Eye Hospital of Shandong First Medical University, Qingdao, China.
Front Public Health. 2022 Aug 16;10:896926. doi: 10.3389/fpubh.2022.896926. eCollection 2022.
The aim of this study was to characterize the temporal and spatial distribution of myopia among students aged 7-18 years, by analyzing the aggregation area and providing the basis for the prevention and control of myopia in China.
A database for the spatial analysis of myopia in China during 1995-2014 was established using ArcGIS10.0 software as a platform for data management and presentation. A spatial autocorrelation analysis of myopia was undertaken, and a temporal and spatial scan analysis was performed using SaTScan9.5 software.
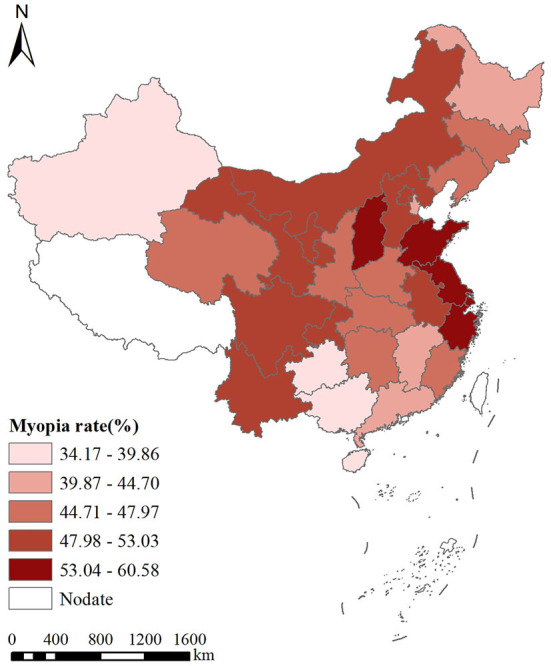
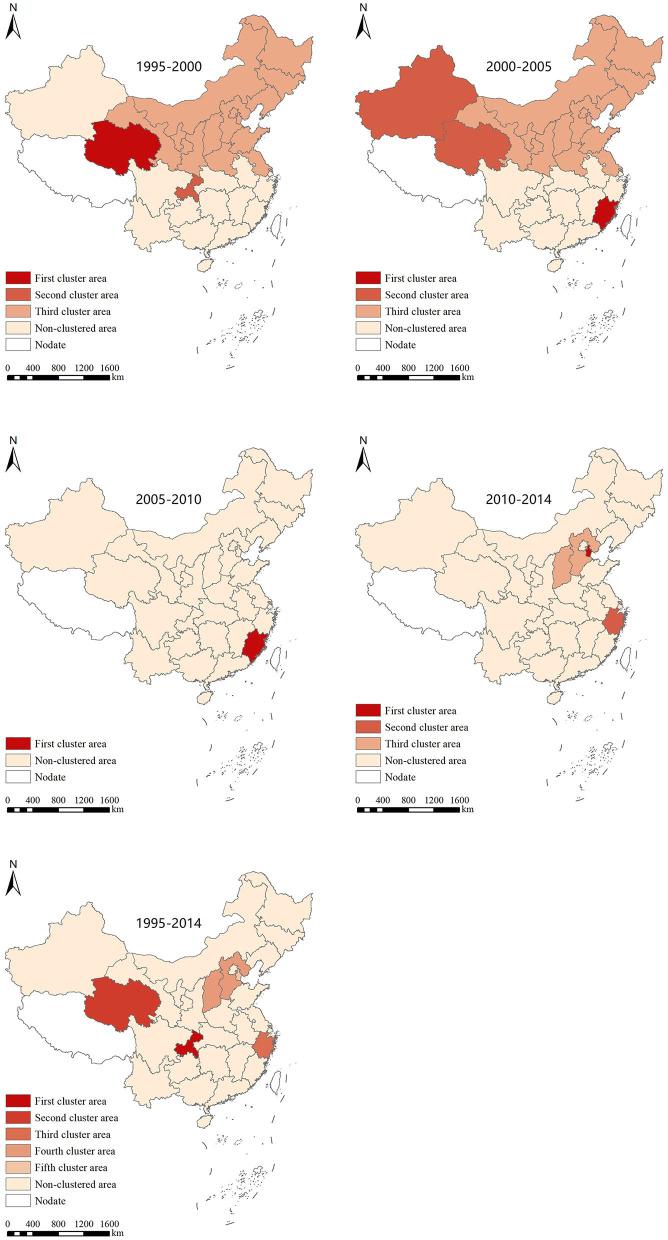
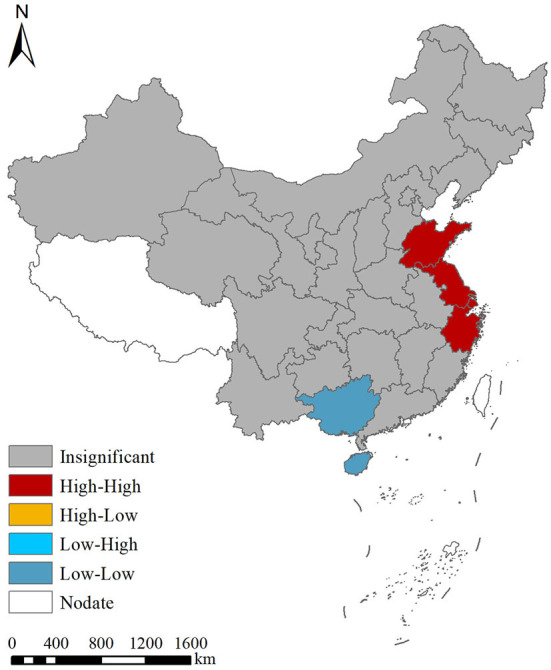
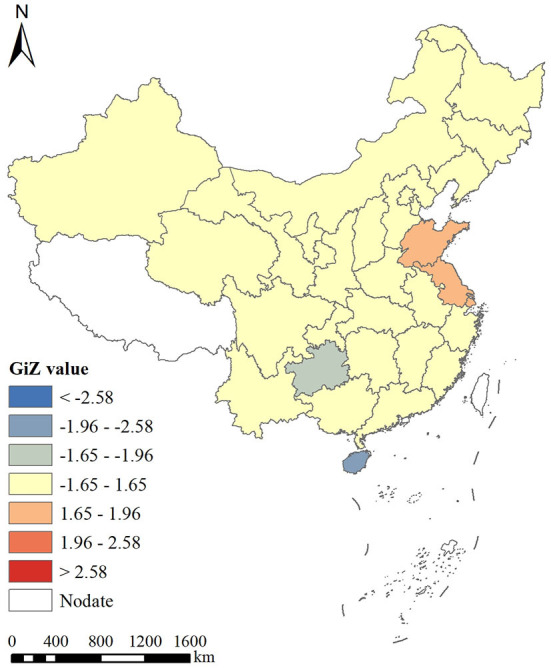
Our data demonstrated that the prevalence of myopia in China in 1995, 2000, 2005, 2010, and 2014 was 35.9, 41.5, 48.7, 57.3, and 57.1%, respectively, thus indicating a gradual upward trend. The prevalence of myopia was analyzed in various provinces (municipalities and autonomous regions), and the highest was found in Jiangsu Province, with an average Moran's index of 0.244295 in China ( ≤ 0.05). According to the local Moran's autocorrelation analysis, there was a spatial aggregation of myopia prevalence among students in the entire country, with Shandong, Jiangsu, Anhui, and Shanghai being classified as high-high aggregation areas, while Hainan and Guangxi were classified as low-low aggregation areas. In addition, the Getis-Ord General results of the global hotspot analysis showed a countrywide myopia prevalence index of 0.035020 and a score of 1.7959 ( = 0.07251). Because the myopia prevalence correlation difference was not statistically significant, there were no "positive hotspots" or "negative hotspots." The local hotspot analysis shows that Shandong and Jiangsu belong to high-value aggregation areas, while Hainan and Guizhou belong to low-value aggregation areas. Further analysis using time-space scanning showed 15 aggregation regions in five stages, with four aggregation regions having statistically significant differences ( ≤ 0.05). However, the aggregation range has changed over time. Overall, from 1995 to 2014, the aggregation areas for the myopia prevalence in Chinese students have shifted from the northwest, north, and northeast regions to the southeast regions.
Our data demonstrate that, from 1995 to 2014, the prevalence of myopia increased in students aged 7-18 years in China. In addition, the prevalence of myopia is randomly distributed in various provinces (municipalities and autonomous regions) and exhibits spatial aggregation. Also, the gathering area is gradually shifting to the southeast, with the existence of high-risk areas. It is, therefore, necessary to focus on this area and undertake targeted prevention and control measures.
本研究旨在通过分析近视的聚集区域,描述 7-18 岁学生近视的时空分布特征,为中国近视的预防和控制提供依据。
本研究以 ArcGIS10.0 软件为平台,建立中国 1995-2014 年近视空间分析数据库,用于数据管理和呈现。利用 SaTScan9.5 软件进行近视的空间自相关分析和时空扫描分析。
1995 年、2000 年、2005 年、2010 年和 2014 年中国学生近视的患病率分别为 35.9%、41.5%、48.7%、57.3%和 57.1%,呈逐渐上升趋势。对各省份(直辖市、自治区)学生近视患病率进行分析,最高的是江苏省,中国平均 Moran's 指数为 0.244295(≤0.05)。根据局部 Moran's 自相关分析,全国学生近视患病率存在空间聚集性,山东、江苏、安徽和上海为高-高聚集区,海南和广西为低-低聚集区。此外,全局热点 Getis-Ord 分析结果显示,全国学生近视患病率指数为 0.035020,得分 1.7959(=0.07251)。由于近视患病率相关性差异无统计学意义,因此不存在“正热点”或“负热点”。局部热点分析表明,山东和江苏属于高值聚集区,而海南和贵州属于低值聚集区。进一步的时空扫描分析显示,五个阶段共出现 15 个聚集区,其中 4 个聚集区差异有统计学意义(≤0.05)。但聚集范围随时间发生变化。总体而言,1995 年至 2014 年,中国学生近视聚集区从西北、北部和东北部逐渐向东南部转移。
1995 年至 2014 年,中国 7-18 岁学生近视患病率呈上升趋势。此外,各省(直辖市、自治区)学生近视患病率呈随机分布,存在空间聚集性,聚集区逐渐向东南方向转移,存在高风险区。因此,有必要关注该地区,并采取有针对性的预防和控制措施。