School of Public Health, Physiotherapy and Sports Science, University College Dublin, Dublin, Ireland.
Ecole des hautes études en santé publique, Paris, France.
Eur J Nutr. 2024 Feb;63(1):135-144. doi: 10.1007/s00394-023-03245-2. Epub 2023 Oct 5.
This cross-sectional study aimed to assess the association between ultra-processed foods consumption and dietary diversity and micronutrient intake in Australia.
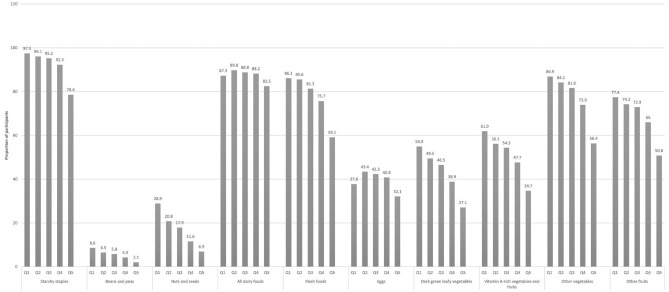
As part of the Nutrition and Physical Activity Survey (2011-2012), 12,153 participants aged 2 years and above were recruited and interviewed. Dietary intake data were collected by two 24-h dietary recalls using the Automated Multiple-Pass Method. The NOVA classification system was used to group the food items based on the extent and purpose of industrial food processing. The mean micronutrient contents were calculated for the total diet, and for two diet fractions; one made up entirely of ultra-processed foods (NOVA group 4) and the other consisting of all non-ultra-processed foods (aggregation of NOVA food groups 1 to 3). The mean micronutrient content in the ultra-processed and non-ultra-processed food diet fractions were compared. Dietary diversity was measured using the ten Food Group Indicators (FGI) of the Food and Agriculture Organization and was defined as the sum number of FGIs per individual. Multiple linear regression models were used to assess the association between the quintiles of energy contribution of ultra-processed foods, dietary diversity, and micronutrient intake.
A negative association was found between quintiles of energy contribution of ultra-processed foods and dietary diversity (β = - 0.43; p < 0.001). The overall micronutrient content was lower in the diet fraction dominated by ultra-processed foods compared to the non-ultra-processed food diet fraction in the study population. The dietary contents of vitamins A, E, C, B9, B12, zinc, calcium, iron, magnesium, potassium, and phosphorus were reduced significantly with increased consumption of ultra-processed foods, even after adjustment for sociodemographic factors and dietary diversity.
The quintiles of energy contribution of ultra-processed foods were negatively associated with dietary diversity and micronutrient intake in Australia.
本横断面研究旨在评估澳大利亚超加工食品消费与饮食多样性和微量营养素摄入之间的关系。
作为营养与体力活动调查(2011-2012 年)的一部分,招募并采访了 12153 名年龄在 2 岁及以上的参与者。通过使用自动多次通过法进行的两次 24 小时膳食回忆收集膳食摄入数据。根据工业食品加工的程度和目的,使用 NOVA 分类系统对食物进行分组。计算了总膳食和两种膳食部分的平均微量营养素含量;一种完全由超加工食品组成(NOVA 组 4),另一种由所有非超加工食品组成(NOVA 食品组 1 至 3 的聚合)。比较了超加工和非超加工食品饮食部分的平均微量营养素含量。使用粮农组织的十种食物组指标(FGI)衡量饮食多样性,并将其定义为个体的 FGI 总和数。使用多元线性回归模型评估超加工食品能量贡献的五分位数、饮食多样性和微量营养素摄入之间的关系。
超加工食品能量贡献的五分位数与饮食多样性呈负相关(β=−0.43;p<0.001)。与非超加工食品饮食部分相比,研究人群中超加工食品为主的饮食部分的总体微量营养素含量较低。即使在调整了社会人口因素和饮食多样性后,随着超加工食品消费的增加,维生素 A、E、C、B9、B12、锌、钙、铁、镁、钾和磷的膳食含量也显著降低。
超加工食品能量贡献的五分位数与澳大利亚的饮食多样性和微量营养素摄入呈负相关。