Department of Oral and Maxillofacial Surgery, the First Affiliated Hospital of Shihezi University, Shihezi, 832000, China.
BMC Med Imaging. 2023 Oct 27;23(1):169. doi: 10.1186/s12880-023-01129-9.
This study sought to evaluate the worth of the general characteristics of enhanced CT images and the histogram parameters of each stage in distinguishing pleomorphic adenoma (PA) and adenolymphoma (AL).
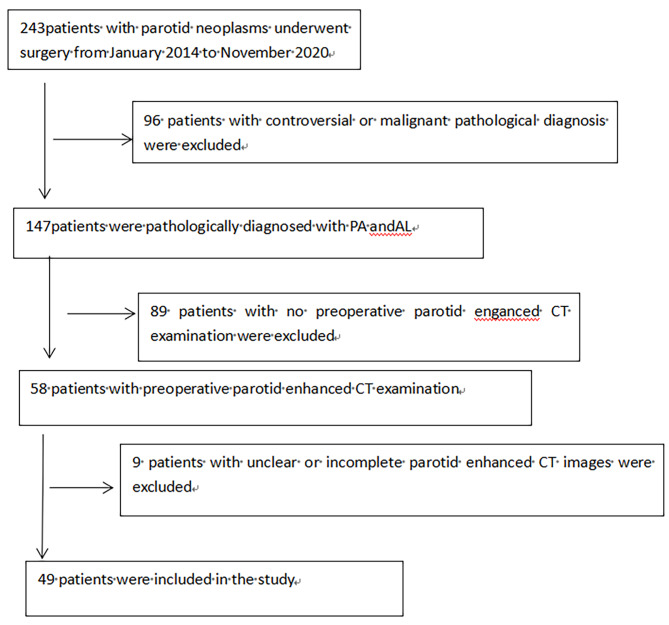
The imaging features and histogram parameters of preoperative enhanced CT images in 20 patients with PA and 29 patients with AL were analyzed. Tumor morphology and histogram parameters of PA and AL were compared. Area under the curve (AUC), sensitivity, and subject operational feature specificity (ROC) analysis were used to determine the differential diagnostic effect of single-stage or multi-stage parameter combinations.
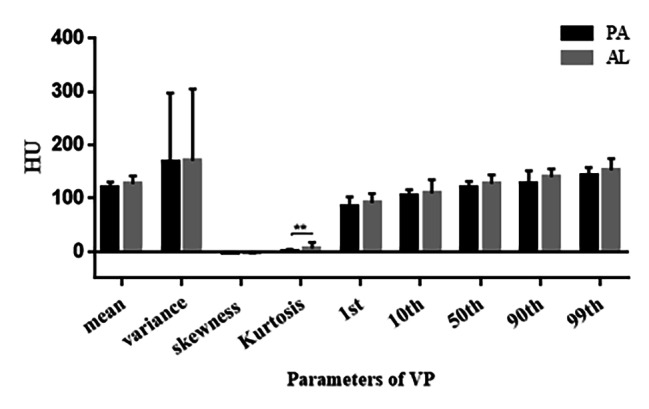
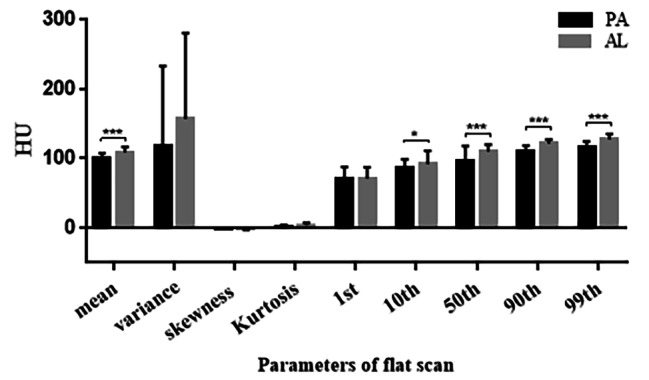
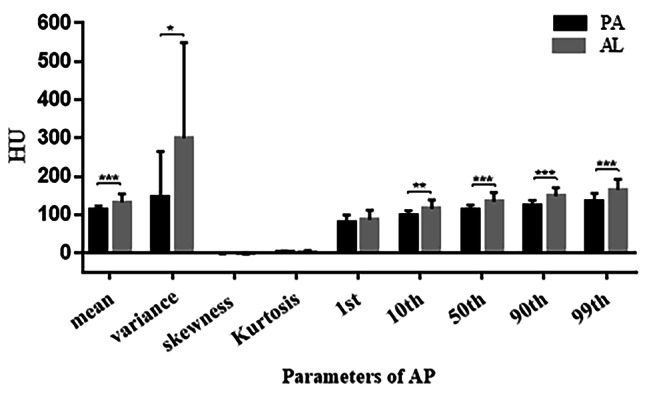
The difference in CT value and net enhancement value of arterial phase (AP) were significant (p < 0.05); Flat sweep phase (FSP), AP mean, percentiles, 10th, 50th, 90th, 99th and arterial period variance and venous phase (VP) kurtosis in the nine histogram parameters of each period (p < 0.05). An analysis of the ROC curve revealed a maximum area beneath the curve (AUC) in the 90th percentile of FSP for a single-parameter differential diagnosis to be 0.870. The diagnostic efficacy of the mean value of FSP + The 90th percentile of AP + Kurtosis of VP was the best in multi-parameter combination diagnosis, with an AUC of 0.925, and the sensitivity and specificity of 0.900 and 0.850, respectively.
The histogram analysis of enhanced CT images is valuable for the differentiation of PA and AL. Moreover, the combination of single-stage parameters or multi-stage parameters can improve the differential diagnosis efficiency.
本研究旨在评估增强 CT 图像的一般特征和各期直方图参数在鉴别多形性腺瘤(PA)和腺淋巴瘤(AL)中的价值。
分析 20 例 PA 和 29 例 AL 患者术前增强 CT 图像的影像学特征和直方图参数,比较 PA 和 AL 的肿瘤形态和直方图参数。采用曲线下面积(AUC)、敏感度和受试者工作特征曲线(ROC)分析,确定单期或多期参数组合的鉴别诊断效果。
动脉期(AP)CT 值和净增强值差异有统计学意义(p<0.05);平扫期(FSP)、AP 均值、各百分位数、第 10 百分位数、第 50 百分位数、第 90 百分位数、第 99 百分位数和动脉期方差以及静脉期(VP)峰度等 9 个直方图参数差异均有统计学意义(p<0.05)。ROC 曲线分析显示,FSP 第 90 百分位数单参数鉴别诊断的最大曲线下面积(AUC)为 0.870。FSP 均值+AP 第 90 百分位数+VP 峰度的多参数组合诊断效能最佳,AUC 为 0.925,敏感度和特异度分别为 0.900 和 0.850。
增强 CT 图像的直方图分析有助于鉴别 PA 和 AL,且单期或多期参数联合可提高鉴别诊断效能。