• 文献检索
  • 文档翻译
  • 深度研究
  • 学术资讯
  • Suppr Zotero 插件Zotero 插件
  • 邀请有礼
  • 套餐&价格
  • 历史记录
应用&插件
Suppr Zotero 插件Zotero 插件浏览器插件Mac 客户端Windows 客户端微信小程序
定价
高级版会员购买积分包购买API积分包
服务
文献检索文档翻译深度研究API 文档MCP 服务
关于我们
关于 Suppr公司介绍联系我们用户协议隐私条款
关注我们

Suppr 超能文献

核心技术专利:CN118964589B侵权必究
粤ICP备2023148730 号-1Suppr @ 2026

文献检索

告别复杂PubMed语法,用中文像聊天一样搜索,搜遍4000万医学文献。AI智能推荐,让科研检索更轻松。

立即免费搜索

文件翻译

保留排版,准确专业,支持PDF/Word/PPT等文件格式,支持 12+语言互译。

免费翻译文档

深度研究

AI帮你快速写综述,25分钟生成高质量综述,智能提取关键信息,辅助科研写作。

立即免费体验

经济增长与中低收入国家儿童营养不良

Economic Growth and Childhood Malnutrition in Low- and Middle-Income Countries.

机构信息

Department of Humanities, Social and Political Sciences, Eidgenössische Technische Hochschule Zürich, Zürich, Switzerland.

Department of Economics and Centre for Modern Indian Studies, University of Göttingen, Göttingen, Germany.

出版信息

JAMA Netw Open. 2023 Nov 1;6(11):e2342654. doi: 10.1001/jamanetworkopen.2023.42654.

DOI:10.1001/jamanetworkopen.2023.42654
PMID:37943556
原文链接:https://pmc.ncbi.nlm.nih.gov/articles/PMC10636637/
Abstract

IMPORTANCE

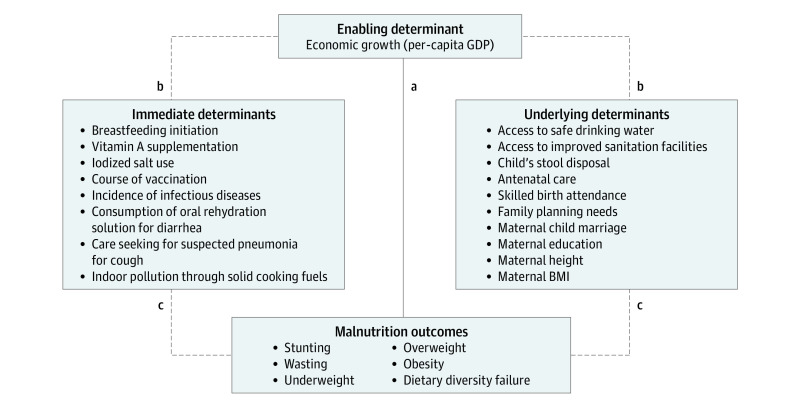
Economic growth may reduce childhood malnutrition through improvements of several contributing factors, but the empirical evidence is mixed. Identifying the most important factors that contribute to child malnutrition and their associations with economic growth can inform decision-making about targeted investments to improve children's health.

OBJECTIVE

To assess the associations between economic growth and malnutrition, contributing factors and malnutrition, and economic growth and contributing factors of malnutrition in low- and middle-income countries (LMICs).

DESIGN, SETTING, AND PARTICIPANTS: This cross-sectional study used data from 239 Demographic and Health Surveys from January 1, 1990, to December 31, 2021. Observations included 1 138 568 children aged 0 to 35 months with valid anthropometric measures and information on contributing factors of malnutrition from 58 LMICs. Data were analyzed from May 20, 2022, to February 16, 2023.

EXPOSURE

National per-capita gross domestic product (GDP) was used as a proxy for economic growth.

MAIN OUTCOMES AND MEASURES

Six measures of childhood malnutrition were constructed: stunting (height-for-age z score <-2), underweight (weight-for-age z score <-2), wasting (weight-for-height z score <-2), overweight (weight-for-height z score >2), obesity (weight-for-height z score >3), and dietary diversity failure (consumption of less than 5 of 8 different food groups in the past 24 hours). Eighteen contributing factors of malnutrition were constructed, of which 10 were underlying determinants (eg, access to improved sanitation) and 8 were immediate determinants (eg, breastfeeding initiation).

RESULTS

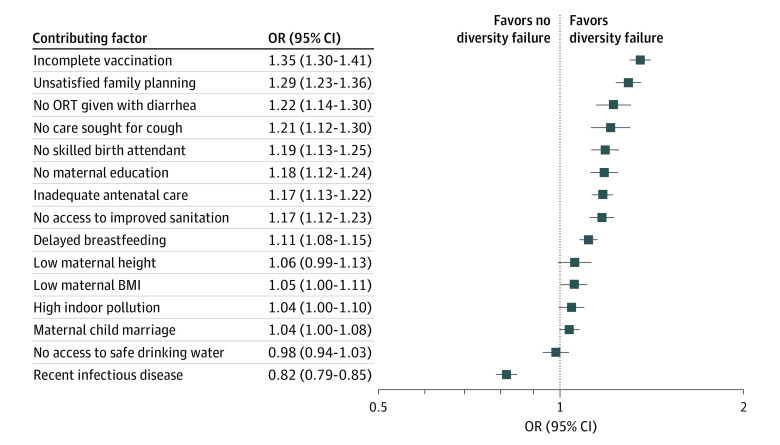
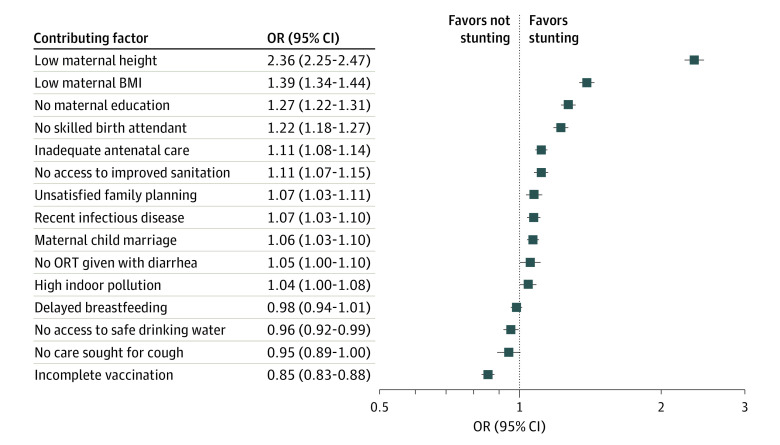
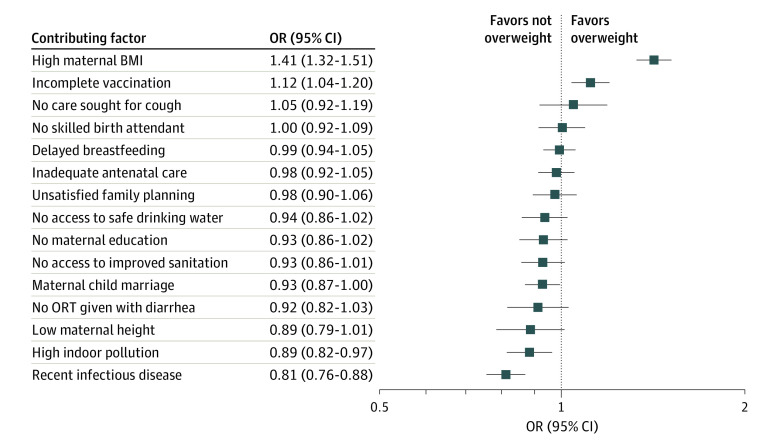
A total of 1 138 568 children (mean [SD] age, 17.14 [10.26] months; 579 589 [50.9%] boys and 558 979 [49.1%] girls) were included in the analysis. Of these, 27.3% (95% CI, 27.2%-27.4%) had stunting; 25.7% (95% CI, 25.6%-25.8%), underweight; 11.2% (95% CI, 11.1%-11.2%), wasting; 3.8% (95% CI, 3.7%-3.8%), overweight; 1.1% (95% CI, 1.1%-1.1%), obesity; and 79.8% (95% CI, 79.7%-79.9%), dietary diversity failure. Per-capita GDP was weakly associated with childhood malnutrition. The odds ratios associated with a 5% increase in per-capita GDP were 0.99 (95% CI, 0.99-1.00) for stunting, 1.01 (95% CI, 1.00-1.01) for wasting, 1.00 (95% CI, 1.00-1.00) for underweight, 0.98 (95% CI, 0.98-0.98) for overweight, 0.98 (95% CI, 0.97-0.98) for obesity, and 1.03 (95% CI, 1.01-1.04) for dietary diversity failure. Although strong associations were found between many contributing factors and most outcomes for malnutrition, associations identified between per-capita GDP and these contributing factors themselves were ambiguous.

CONCLUSIONS AND RELEVANCE

In this multicountry cross-sectional study, economic growth was weakly associated with childhood malnutrition and several contributing factors. To reduce child malnutrition, economic growth may need to be accompanied by more targeted investments to improve contributing factors that are strongly associated with child malnutrition, such as maternal health and education.

摘要

重要性:经济增长可能通过改善几个促成因素来减少儿童营养不良,但实证证据参差不齐。确定导致儿童营养不良的最重要因素及其与经济增长的关联,可以为有针对性地投资改善儿童健康提供决策依据。

目的:评估经济增长与营养不良、促成因素与营养不良以及中低收入国家(LMIC)中经济增长与营养不良促成因素之间的关联。

设计、地点和参与者:本横断面研究使用了 1990 年 1 月 1 日至 2021 年 12 月 31 日期间来自 239 项人口与健康调查的数据。观察对象包括来自 58 个 LMIC 的 581588 名 0 至 35 个月大的儿童,他们的身高、体重和其他信息均可用,可用于评估营养状况。数据分析于 2022 年 5 月 20 日至 2023 年 2 月 16 日进行。

暴露:人均国内生产总值(GDP)被用作经济增长的代理指标。

主要结果和措施:构建了 6 种儿童营养不良衡量指标:发育迟缓(身高年龄 Z 分数<-2)、消瘦(体重年龄 Z 分数<-2)、消瘦(体重身高 Z 分数<-2)、超重(体重身高 Z 分数>2)、肥胖(体重身高 Z 分数>3)和饮食多样性失败(过去 24 小时内摄入不到 8 种不同食物组中的 5 种)。构建了 18 种营养不良促成因素,其中 10 种是潜在决定因素(如获得改善的卫生设施),8 种是直接决定因素(如母乳喂养开始时间)。

结果:共纳入 1138568 名儿童(平均[SD]年龄,17.14[10.26]个月;579589 名[50.9%]男孩和 558979 名[49.1%]女孩)进行分析。其中,27.3%(95%CI,27.2%-27.4%)发育迟缓;25.7%(95%CI,25.6%-25.8%),消瘦;11.2%(95%CI,11.1%-11.2%),消瘦;3.8%(95%CI,3.7%-3.8%),超重;1.1%(95%CI,1.1%-1.1%),肥胖;79.8%(95%CI,79.7%-79.9%),饮食多样性失败。人均 GDP 与儿童营养不良呈弱相关。与人均 GDP 增加 5%相关的比值比为 0.99(95%CI,0.99-1.00),与发育迟缓相关;1.01(95%CI,1.00-1.01),与消瘦相关;1.00(95%CI,1.00-1.00),与消瘦相关;0.98(95%CI,0.98-0.98),与超重相关;0.98(95%CI,0.97-0.98),与肥胖相关;1.03(95%CI,1.01-1.04),与饮食多样性失败相关。虽然许多促成因素与大多数营养不良结果之间存在很强的关联,但人均 GDP 与这些促成因素之间的关联并不明确。

结论:在这项多国家横断面研究中,经济增长与儿童营养不良和几个促成因素之间存在弱相关。为了减少儿童营养不良,经济增长可能需要伴随着更多有针对性的投资,以改善与儿童营养不良密切相关的促成因素,如母婴健康和教育。

https://cdn.ncbi.nlm.nih.gov/pmc/blobs/ef94/10636637/eb10cf4292ce/jamanetwopen-e2342654-g004.jpg
https://cdn.ncbi.nlm.nih.gov/pmc/blobs/ef94/10636637/8df7209f55af/jamanetwopen-e2342654-g001.jpg
https://cdn.ncbi.nlm.nih.gov/pmc/blobs/ef94/10636637/4fffa2f8c85b/jamanetwopen-e2342654-g002.jpg
https://cdn.ncbi.nlm.nih.gov/pmc/blobs/ef94/10636637/50285209095b/jamanetwopen-e2342654-g003.jpg
https://cdn.ncbi.nlm.nih.gov/pmc/blobs/ef94/10636637/eb10cf4292ce/jamanetwopen-e2342654-g004.jpg

相似文献

1
Economic Growth and Childhood Malnutrition in Low- and Middle-Income Countries.经济增长与中低收入国家儿童营养不良
JAMA Netw Open. 2023 Nov 1;6(11):e2342654. doi: 10.1001/jamanetworkopen.2023.42654.
2
Factors Associated With Child Stunting, Wasting, and Underweight in 35 Low- and Middle-Income Countries.35 个中低收入国家与儿童发育迟缓、消瘦和体重不足相关的因素。
JAMA Netw Open. 2020 Apr 1;3(4):e203386. doi: 10.1001/jamanetworkopen.2020.3386.
3
Association between economic growth and early childhood undernutrition: evidence from 121 Demographic and Health Surveys from 36 low-income and middle-income countries.经济增长与儿童早期营养不良之间的关联:来自 36 个低收入和中等收入国家的 121 项人口与健康调查的证据。
Lancet Glob Health. 2014 Apr;2(4):e225-34. doi: 10.1016/S2214-109X(14)70025-7. Epub 2014 Mar 27.
4
Is economic growth associated with reduction in child undernutrition in India?经济增长与印度儿童营养不足减少有关吗?
PLoS Med. 2011 Mar;8(3):e1000424. doi: 10.1371/journal.pmed.1000424. Epub 2011 Mar 8.
5
Comparison of Child Undernutrition Anthropometric Indicators Across 56 Low- and Middle-Income Countries.56 个低收入和中等收入国家儿童营养不足的人体测量指标比较。
JAMA Netw Open. 2022 Mar 1;5(3):e221223. doi: 10.1001/jamanetworkopen.2022.1223.
6
Global, regional and national epidemiology and prevalence of child stunting, wasting and underweight in low- and middle-income countries, 2006-2018.全球、区域和国家层面中低收入国家儿童发育迟缓、消瘦和体重不足的流行病学和流行率:2006-2018 年。
Sci Rep. 2021 Mar 4;11(1):5204. doi: 10.1038/s41598-021-84302-w.
7
Association between maternal stature and household-level double burden of malnutrition: findings from a comprehensive analysis of Ethiopian Demographic and Health Survey.母亲身高与家庭层面营养不良双重负担的关联:来自埃塞俄比亚人口与健康调查综合分析的结果。
J Health Popul Nutr. 2023 Jan 24;42(1):7. doi: 10.1186/s41043-023-00347-9.
8
Prevalence of malnutrition among children and women of reproductive age in Uruguay by socio-economic status and educational level.乌拉圭按社会经济地位和教育水平划分的儿童和育龄妇女营养不良患病率。
Public Health Nutr. 2020 Aug;23(S1):s101-s107. doi: 10.1017/S1368980020000804. Epub 2020 Apr 17.
9
Assessment of Undernutrition Among Children in 55 Low- and Middle-Income Countries Using Dietary and Anthropometric Measures.利用膳食和人体测量指标评估 55 个中低收入国家儿童的营养不足情况。
JAMA Netw Open. 2021 Aug 2;4(8):e2120627. doi: 10.1001/jamanetworkopen.2021.20627.
10
The influence of dietary diversity on the nutritional status of children between 6 and 23 months of age in Tanzania.饮食多样性对坦桑尼亚6至23个月大儿童营养状况的影响。
BMC Pediatr. 2019 Dec 28;19(1):518. doi: 10.1186/s12887-019-1897-5.

引用本文的文献

1
Nutritional Challenges Among Children Under Five in Limpopo Province, South Africa: Complementary Feeding Practices and Dietary Diversity Deficits.南非林波波省五岁以下儿童面临的营养挑战:辅食喂养习惯与饮食多样性不足
Nutrients. 2025 Jun 3;17(11):1919. doi: 10.3390/nu17111919.
2
Evaluating the knowledge, roles, and skills of health cadres in stunting prevention: A mixed-method study in Indonesia.评估卫生干部在预防发育迟缓方面的知识、角色和技能:印度尼西亚的一项混合方法研究。
Belitung Nurs J. 2025 May 27;11(3):330-339. doi: 10.33546/bnj.3722. eCollection 2025.
3
Monitoring determinants of the prevalence of child malnutrition in Brazil according to indicators of the 2030 Agenda in the year 2022.

本文引用的文献

1
Determinants of malnutrition among children: A systematic review.儿童营养不良的决定因素:系统评价。
Nutrition. 2022 Apr;96:111565. doi: 10.1016/j.nut.2021.111565. Epub 2021 Dec 11.
2
Assessment of Undernutrition Among Children in 55 Low- and Middle-Income Countries Using Dietary and Anthropometric Measures.利用膳食和人体测量指标评估 55 个中低收入国家儿童的营养不足情况。
JAMA Netw Open. 2021 Aug 2;4(8):e2120627. doi: 10.1001/jamanetworkopen.2021.20627.
3
All children surviving and thriving: re-envisioning UNICEF's conceptual framework of malnutrition.
根据2030年议程指标,于2022年监测巴西儿童营养不良患病率的决定因素。
Rev Bras Epidemiol. 2025 Jan 31;28:e250001. doi: 10.1590/1980-549720250001. eCollection 2025.
4
Protecting optimal childhood growth: systematic nutritional screening, assessment, and intervention for children at risk of malnutrition in the Kingdom of Saudi Arabia.保护儿童最佳生长发育:沙特阿拉伯王国对营养不良风险儿童进行系统的营养筛查、评估和干预。
Front Nutr. 2024 Nov 7;11:1483234. doi: 10.3389/fnut.2024.1483234. eCollection 2024.
5
seen : 1. Stunting and overweight/obesity are predominant malnutrition burdens of urban poor Nigerian adolescents.现状:1. 发育迟缓与超重/肥胖是尼日利亚城市贫困青少年主要的营养不良负担。
Ann Glob Health. 2024 Nov 4;90(1):64. doi: 10.5334/aogh.4550. eCollection 2024.
6
Using mid-upper arm circumference -score measurement to support youth malnutrition screening as part of a global sports and wellness program and improve access to nutrition care.使用上臂中部周长评分测量法,以支持将青少年营养不良筛查作为全球体育与健康计划的一部分,并改善营养护理的可及性。
Front Nutr. 2024 Aug 12;11:1423978. doi: 10.3389/fnut.2024.1423978. eCollection 2024.
7
Navigating the nutritional paradox: The impact of sustainable development targets on childhood wasting and overweight prevalence.应对营养悖论:可持续发展目标对儿童消瘦和超重患病率的影响。
PLOS Glob Public Health. 2024 Jun 21;4(6):e0003335. doi: 10.1371/journal.pgph.0003335. eCollection 2024.
8
Nutritional status of infants and young children in India across three decades: Analysis of five national family health surveys.印度婴幼儿营养状况三十年变化:五次国家家庭健康调查分析。
Eur J Clin Nutr. 2024 Jul;78(7):591-606. doi: 10.1038/s41430-024-01427-7. Epub 2024 Mar 11.
让所有儿童生存并茁壮成长:重新构想联合国儿童基金会的营养不良概念框架。
Lancet Glob Health. 2020 Jun;8(6):e766-e767. doi: 10.1016/S2214-109X(20)30122-4.
4
Ultra-Processed Food Consumption among the Paediatric Population: An Overview and Call to Action from the European Childhood Obesity Group.儿科人群中超加工食品的消费:欧洲儿童肥胖问题小组的概述与行动呼吁
Ann Nutr Metab. 2020;76(2):109-113. doi: 10.1159/000507840. Epub 2020 Apr 28.
5
Factors Associated With Child Stunting, Wasting, and Underweight in 35 Low- and Middle-Income Countries.35 个中低收入国家与儿童发育迟缓、消瘦和体重不足相关的因素。
JAMA Netw Open. 2020 Apr 1;3(4):e203386. doi: 10.1001/jamanetworkopen.2020.3386.
6
Does economic growth reduce childhood stunting? A multicountry analysis of 89 Demographic and Health Surveys in sub-Saharan Africa.经济增长能否减少儿童发育迟缓?对撒哈拉以南非洲 89 项人口与健康调查的多国分析。
BMJ Glob Health. 2020 Jan 23;5(1):e002042. doi: 10.1136/bmjgh-2019-002042. eCollection 2020.
7
Assessing associational strength of 23 correlates of child anthropometric failure: An econometric analysis of the 2015-2016 National Family Health Survey, India.评估 23 项儿童人体测量失败相关因素的关联强度:对印度 2015-2016 年国家家庭健康调查的计量经济学分析。
Soc Sci Med. 2019 Oct;238:112374. doi: 10.1016/j.socscimed.2019.112374. Epub 2019 Jun 20.
8
Causal Effect of Parental Schooling on Early Childhood Undernutrition: Quasi-Experimental Evidence From Zimbabwe.父母受教育程度对儿童早期营养不足的因果效应:来自津巴布韦的准实验证据。
Am J Epidemiol. 2018 Jan 1;187(1):82-93. doi: 10.1093/aje/kwx195.
9
Stunting, Underweight and Overweight in Children Aged 2.0-4.9 Years in Indonesia: Prevalence Trends and Associated Risk Factors.印度尼西亚2.0至4.9岁儿童的发育迟缓、体重不足和超重:患病率趋势及相关风险因素
PLoS One. 2016 May 11;11(5):e0154756. doi: 10.1371/journal.pone.0154756. eCollection 2016.
10
Association between economic growth and early childhood undernutrition: evidence from 121 Demographic and Health Surveys from 36 low-income and middle-income countries.经济增长与儿童早期营养不良之间的关联:来自 36 个低收入和中等收入国家的 121 项人口与健康调查的证据。
Lancet Glob Health. 2014 Apr;2(4):e225-34. doi: 10.1016/S2214-109X(14)70025-7. Epub 2014 Mar 27.