Food Policy Division, The George Institute for Global Health, University of New South Wales, Sydney, NSW 2042, Australia.
Carolina Population Center, The University of North Carolina at Chapel Hill, Chapel Hill, NC 27516, USA.
Nutrients. 2017 Jul 27;9(8):809. doi: 10.3390/nu9080809.
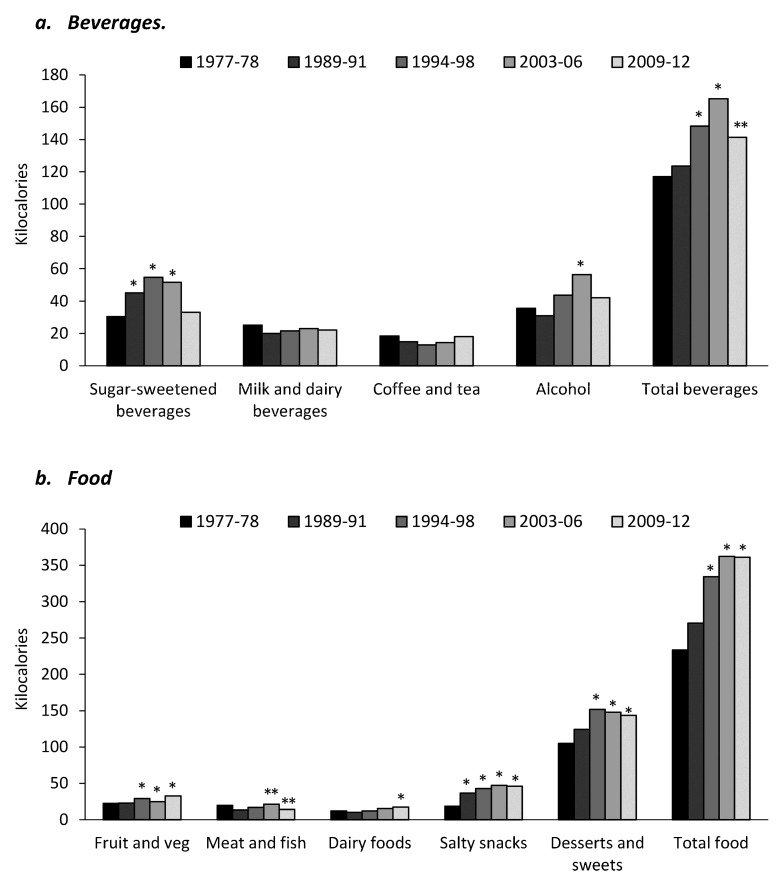
Previous studies have indicated that snacking is contributing to increased calories in the American diet, and that the contribution of snacks to energy intake has increased in recent decades.
The objective was to examine trends in the energy intake deriving from snacks and food sources of snacks for US adults over 35 years from 1977 to 2012, and whether these trends differ across sociodemographic groups.
Participants included 74,291 US adults aged ≥19 years who participated in the 1977-1978 Nationwide Food Consumption Survey (NFCS); the 1989-1991 Continuing Survey of Food Intake by Individuals (CSFII), the 1994-1996 CSFII, the 1997-1998 CSFII, National Health and Nutrition Examination Survey (NHANES) 2003-2004, NHANES 2005-2006, NHANES 2009-2010 and NHANES 2011-2012; all surveys are a stratified random sample of the total civilian, non-institutionalized US population. Overall patterns of snacking, trends in energy intake from snacking, trends in snacking food and beverage sources and energy intake from snacks across racial/ethnic, age, education and income groups were examined.
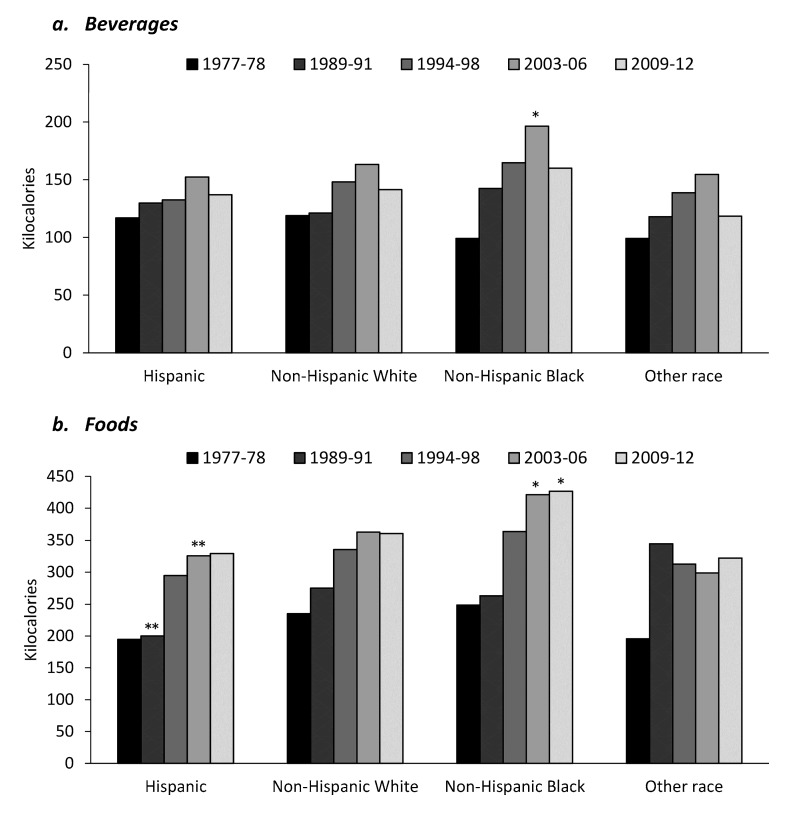
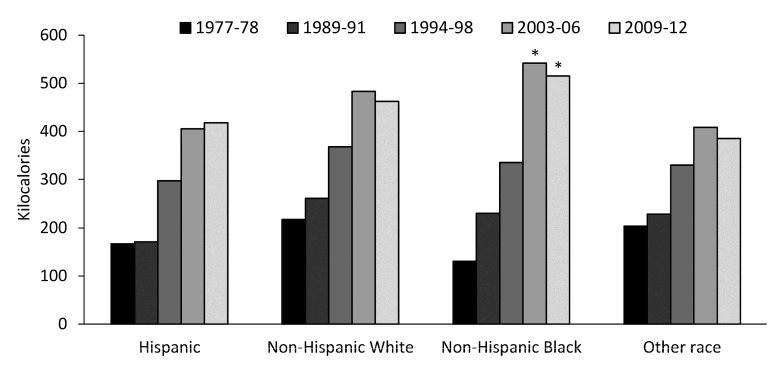
For all US adults there was a significant increase in per capita energy intake from snacks from 1977 to 2012 ( < 0.01). Non-Hispanic blacks had the highest snacking energy intake from sugar-sweetened beverages (SSBs) in each year ( < 0.01 for all), with a peak intake in 2003-2006 of 76 kcal per capita per day. Intake of salty snacks increased in all groups between 1977 and 2012, with non-Hispanic blacks having the highest intake in 2009-2012 ( < 0.01). No significant differences were found between income or education groups.
Results show that snacking remains a significant component of the US diet and the foods consumed at these snacks (SSBs, desserts and sweets and salty snacks) are not the types of foods recommended by the US dietary guidelines. Our finding that non-Hispanic blacks are consuming a higher proportion of SSBs and salty snacks than other groups, and showing the largest increase in energy intake deriving from snacks overall over the past 35 years, is indeed concerning.
先前的研究表明,零食的摄入导致了美国人饮食中卡路里的增加,而且近年来零食在总能量摄入中的占比也有所上升。
本研究旨在探讨 1977 年至 2012 年间美国成年人零食和零食食物来源的能量摄入趋势,并分析这些趋势在不同社会人口学群体中的差异。
研究对象为 74291 名年龄≥19 岁的美国成年人,他们参加了 1977-1978 年全国食物消费调查(NFCS);1989-1991 年个体食物摄入连续调查(CSFII)、1994-1996 年 CSFII、1997-1998 年 CSFII、国家健康与营养调查(NHANES)2003-2004 年、NHANES 2005-2006 年、NHANES 2009-2010 年和 NHANES 2011-2012 年。所有调查均为美国总人口中具有代表性的分层随机抽样。本研究分析了美国成年人的整体零食消费模式、零食能量摄入的变化趋势、零食的食物和饮料来源以及不同种族/民族、年龄、教育和收入群体的零食能量摄入。
1977 年至 2012 年,所有美国成年人的人均零食能量摄入均呈显著上升趋势(<0.01)。非西班牙裔黑人每年的含糖饮料(SSB)零食能量摄入最高(所有年份均<0.01),2003-2006 年的人均摄入量达到每天 76 千卡。1977 年至 2012 年间,所有人群的咸味零食摄入量均呈上升趋势,2009-2012 年非西班牙裔黑人的摄入量最高(<0.01)。不同收入或教育群体之间不存在显著差异。
研究结果表明,零食仍然是美国饮食的重要组成部分,而这些零食中所摄入的食物(SSB、甜点和糖果以及咸味零食)并非美国膳食指南推荐的食物类型。我们发现,非西班牙裔黑人摄入的 SSB 和咸味零食比例高于其他群体,且在过去 35 年中,零食带来的能量摄入总体增幅最大,这确实令人担忧。