• 文献检索
  • 文档翻译
  • 深度研究
  • 学术资讯
  • Suppr Zotero 插件Zotero 插件
  • 邀请有礼
  • 套餐&价格
  • 历史记录
应用&插件
Suppr Zotero 插件Zotero 插件浏览器插件Mac 客户端Windows 客户端微信小程序
定价
高级版会员购买积分包购买API积分包
服务
文献检索文档翻译深度研究API 文档MCP 服务
关于我们
关于 Suppr公司介绍联系我们用户协议隐私条款
关注我们

Suppr 超能文献

核心技术专利:CN118964589B侵权必究
粤ICP备2023148730 号-1Suppr @ 2026

文献检索

告别复杂PubMed语法,用中文像聊天一样搜索,搜遍4000万医学文献。AI智能推荐,让科研检索更轻松。

立即免费搜索

文件翻译

保留排版,准确专业,支持PDF/Word/PPT等文件格式,支持 12+语言互译。

免费翻译文档

深度研究

AI帮你快速写综述,25分钟生成高质量综述,智能提取关键信息,辅助科研写作。

立即免费体验

欧洲人群当前国家膳食调查中的成年人营养素摄入量。

Adult Nutrient Intakes from Current National Dietary Surveys of European Populations.

机构信息

Nutritional Epidemiology Group (NEG), School of Food Science and Nutrition, University of Leeds, Leeds LS2 9JT, UK.

Division of Noncommunicable Diseases and Promoting Health through the Life-Course, World Health Organization Regional Office for Europe, UN City, Marmorvej 51, DK-2100 Copenhagen, Denmark.

出版信息

Nutrients. 2017 Nov 27;9(12):1288. doi: 10.3390/nu9121288.

DOI:10.3390/nu9121288
PMID:29186935
原文链接:https://pmc.ncbi.nlm.nih.gov/articles/PMC5748739/
Abstract

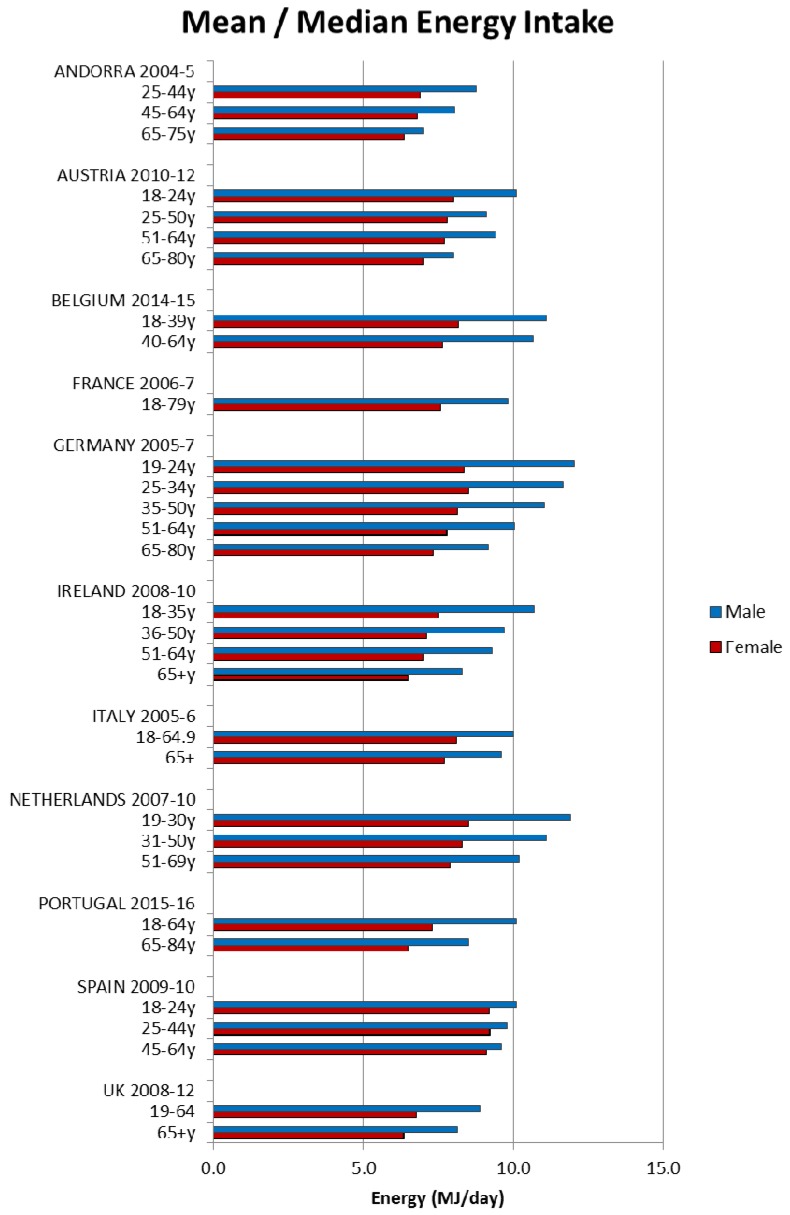
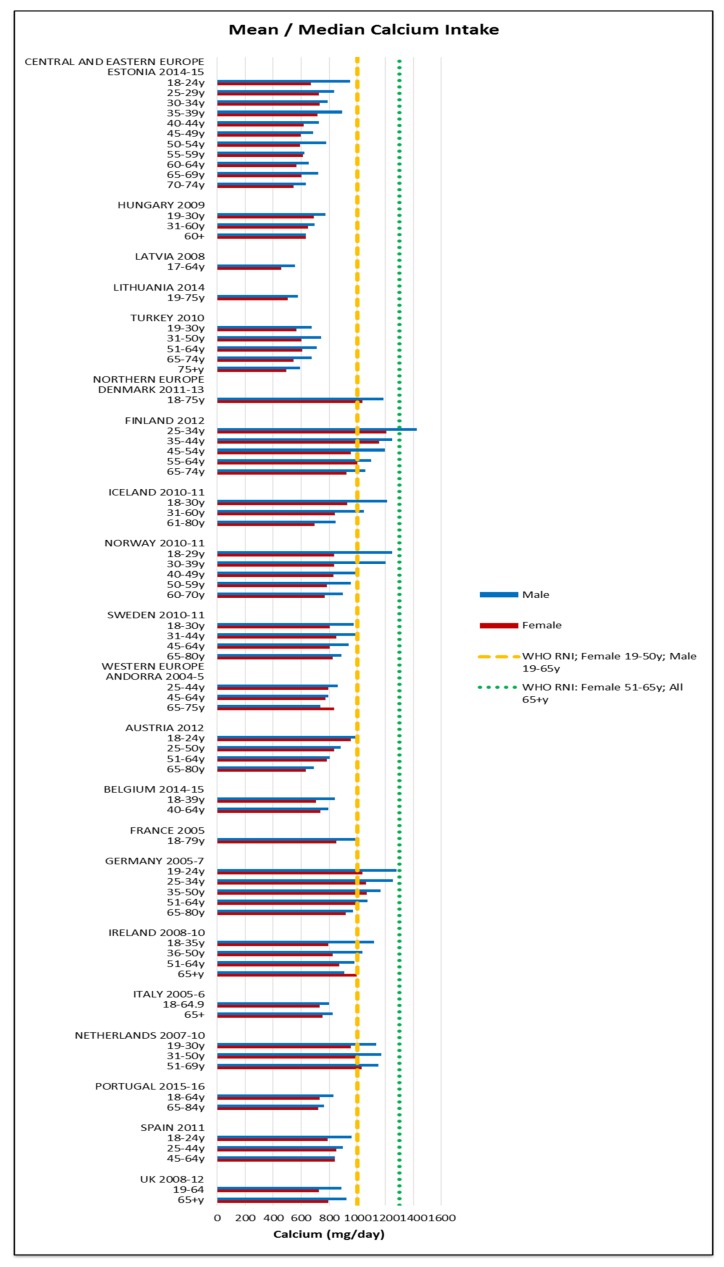
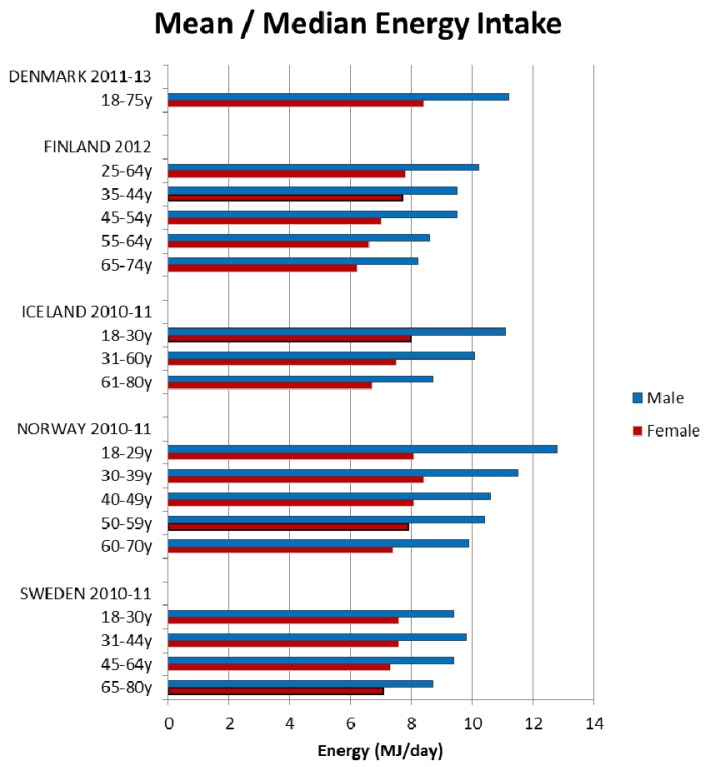
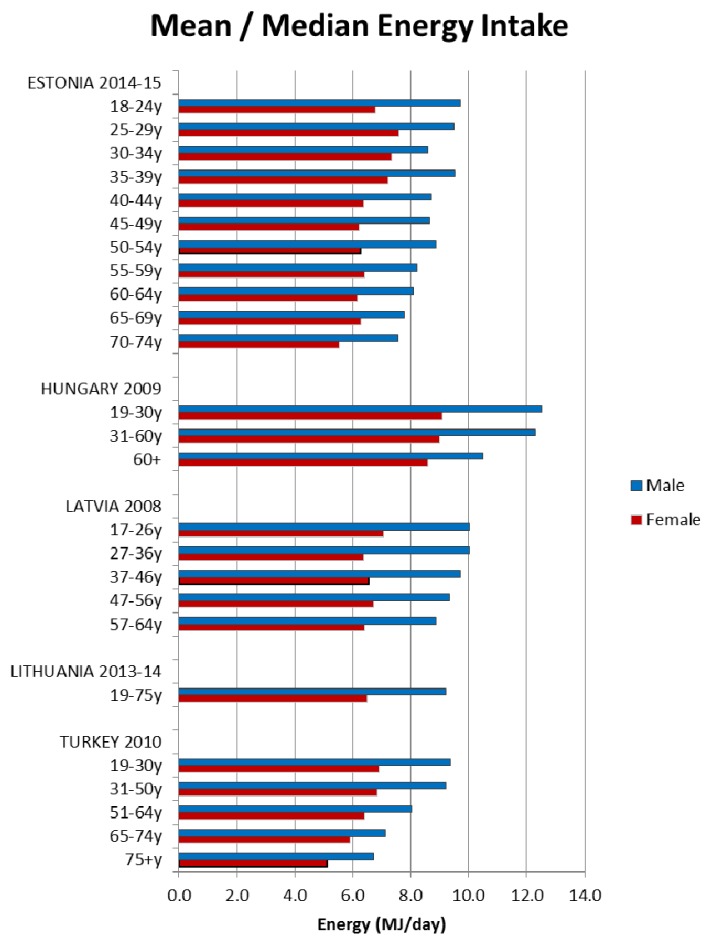
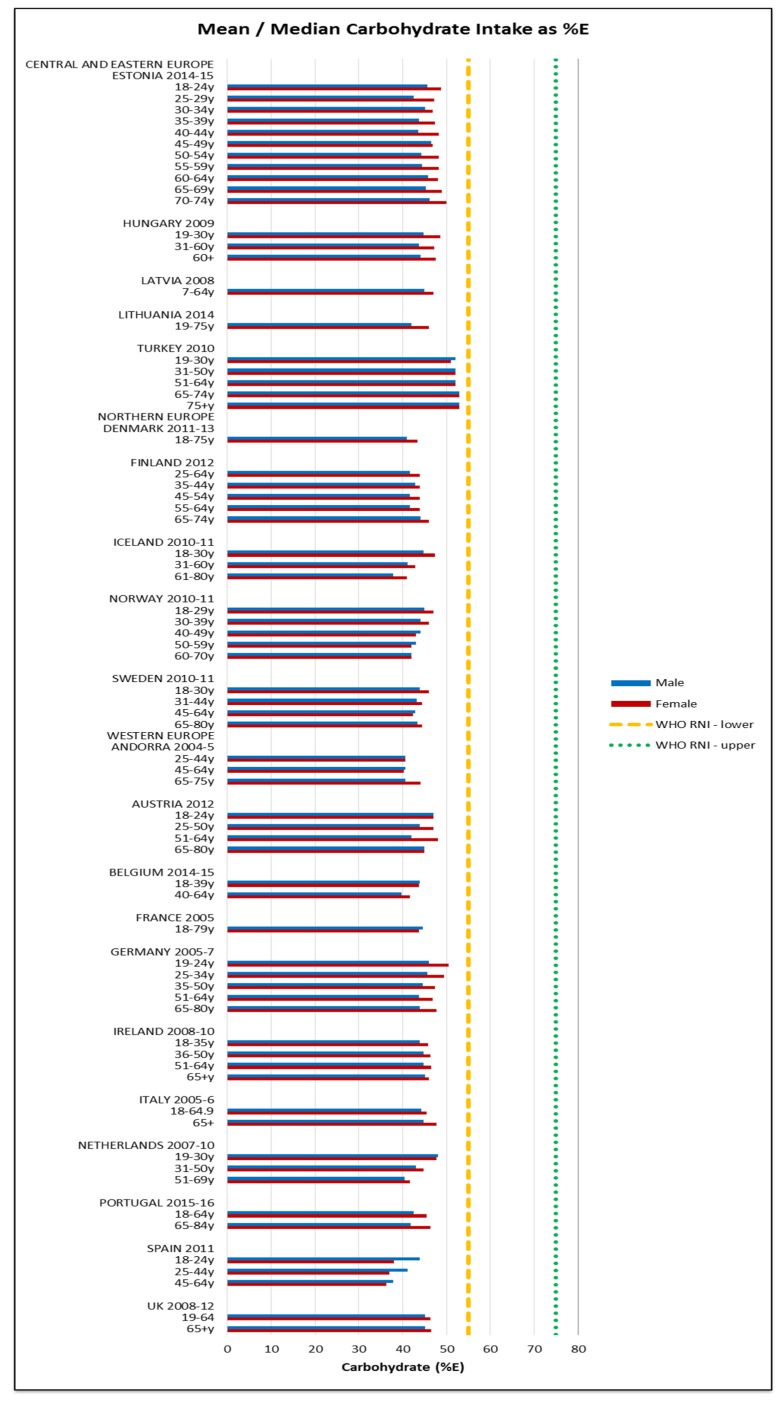
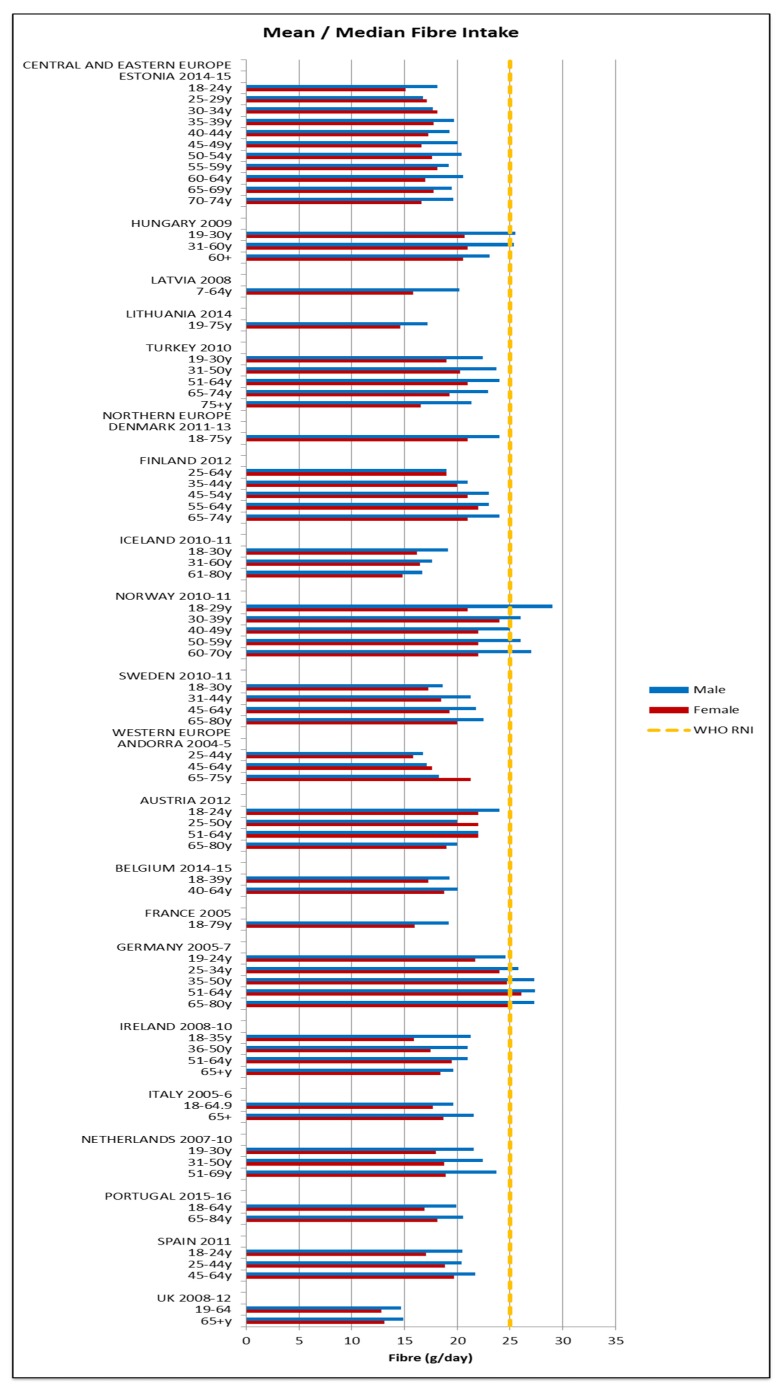
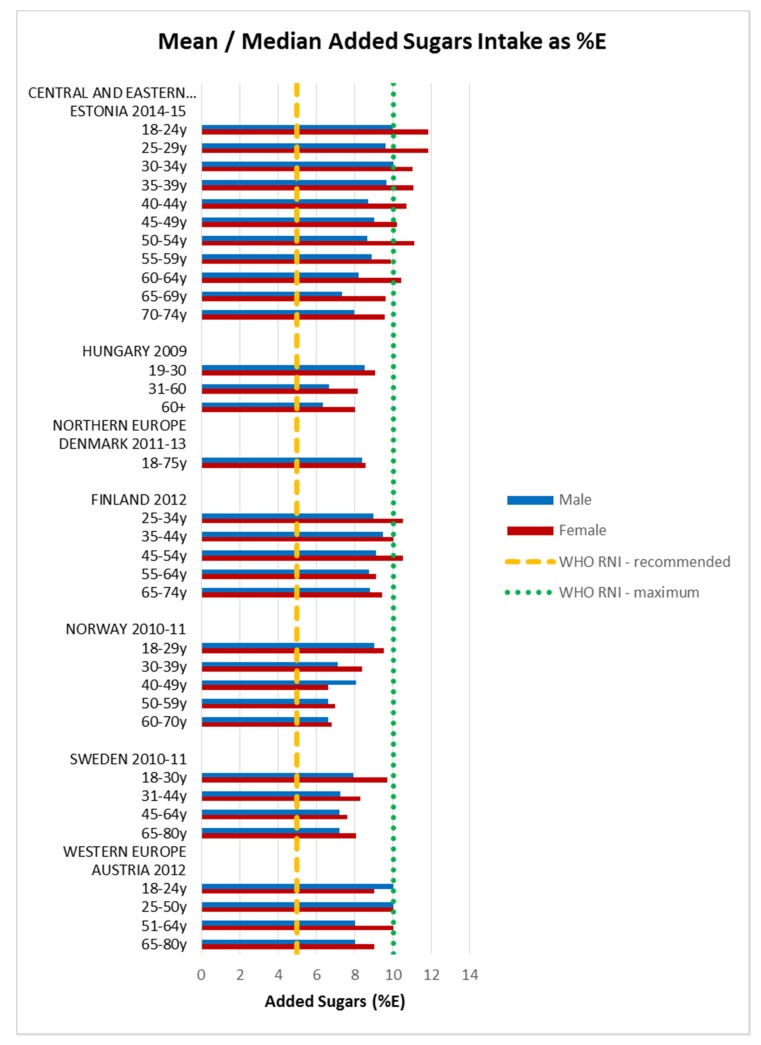
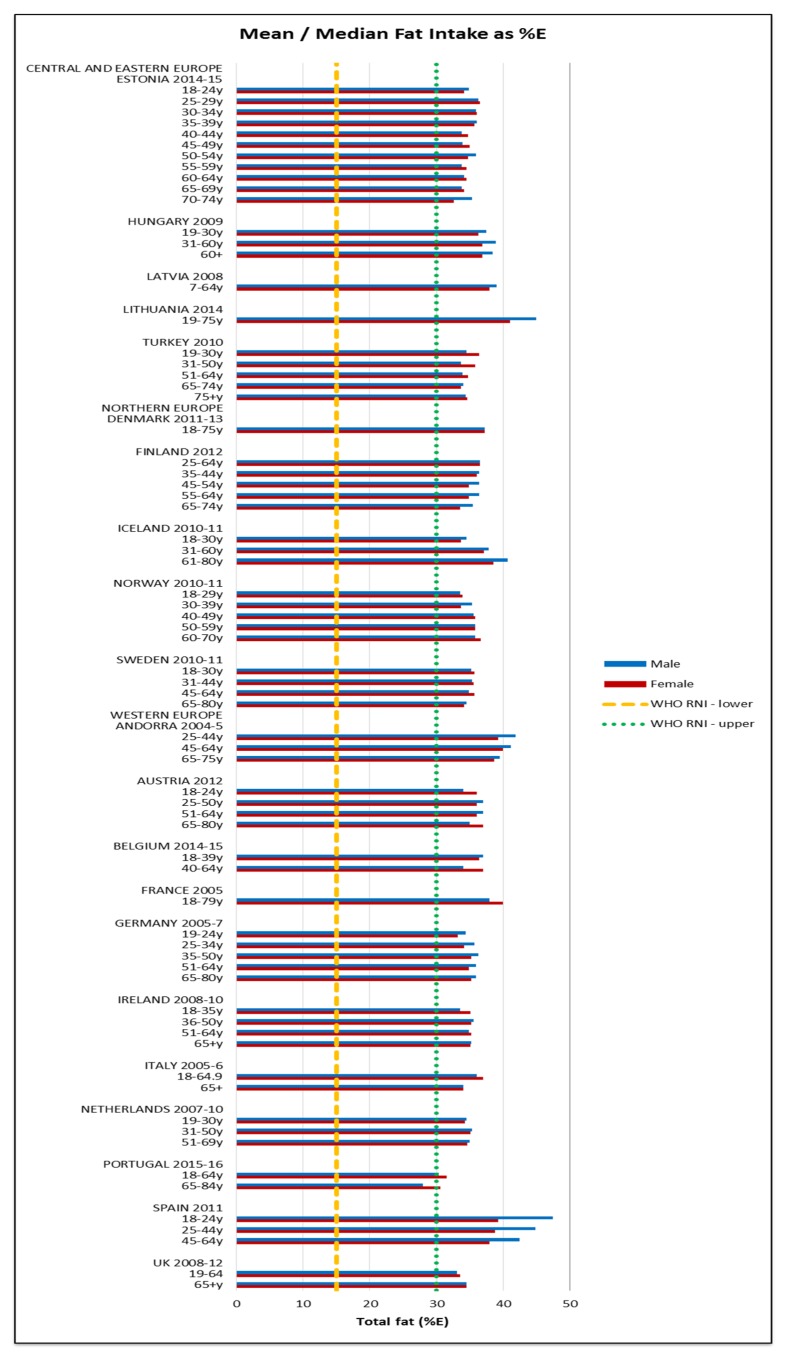
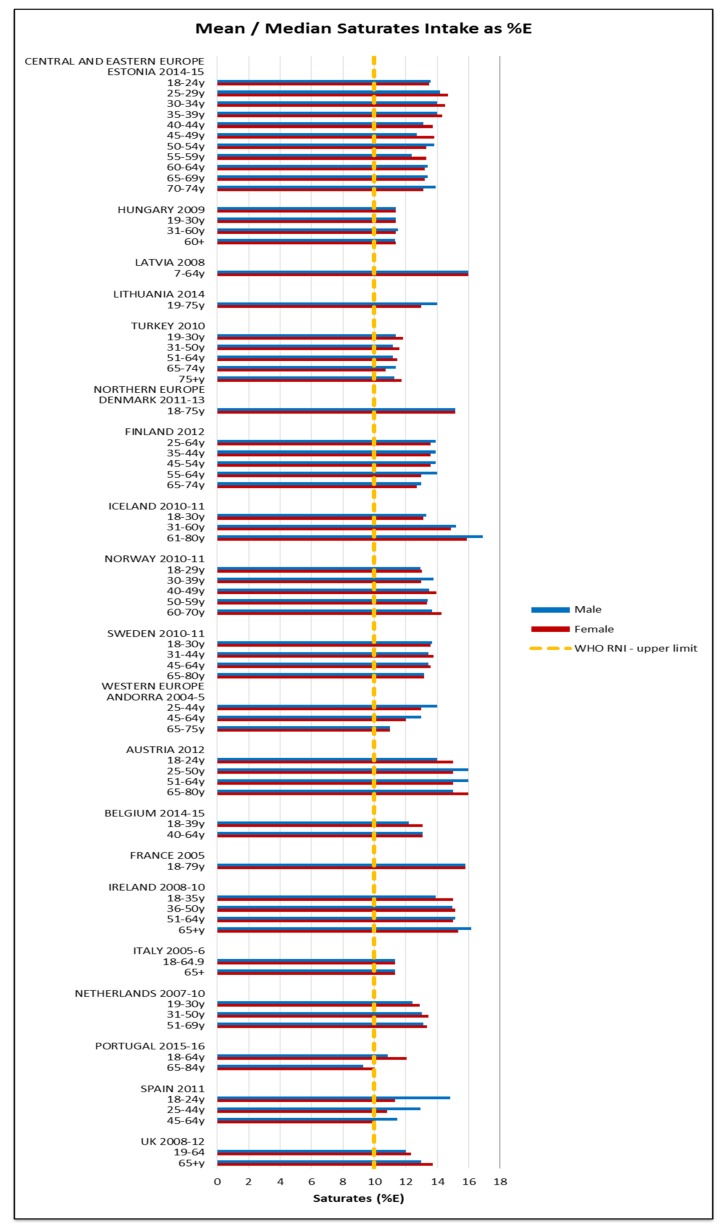
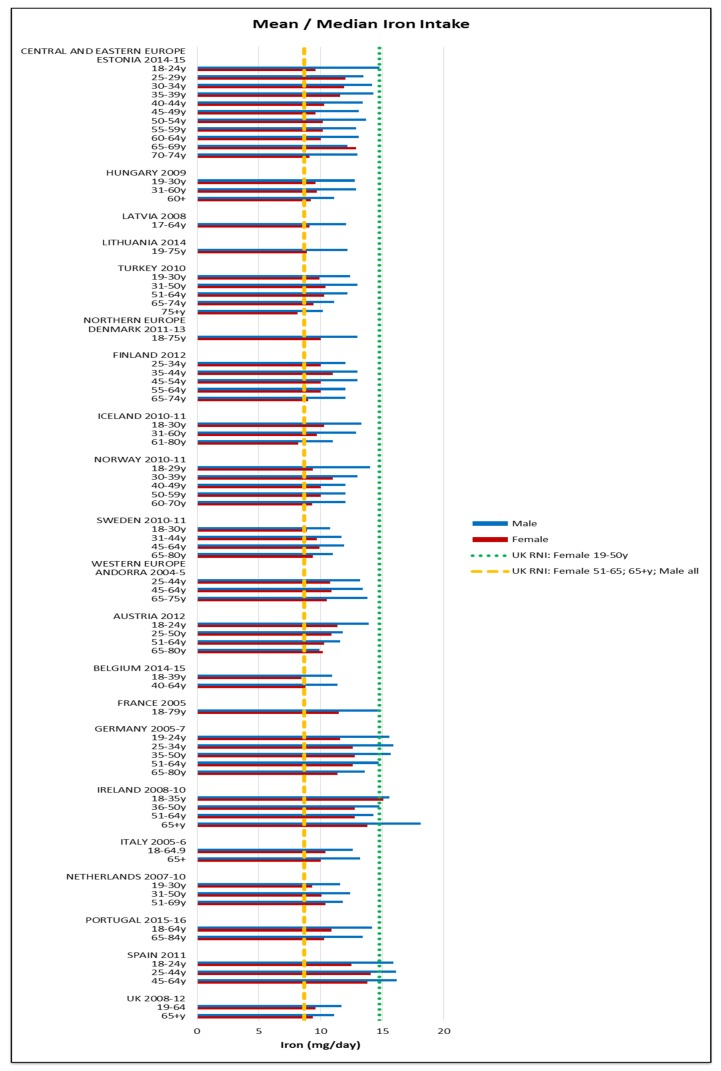
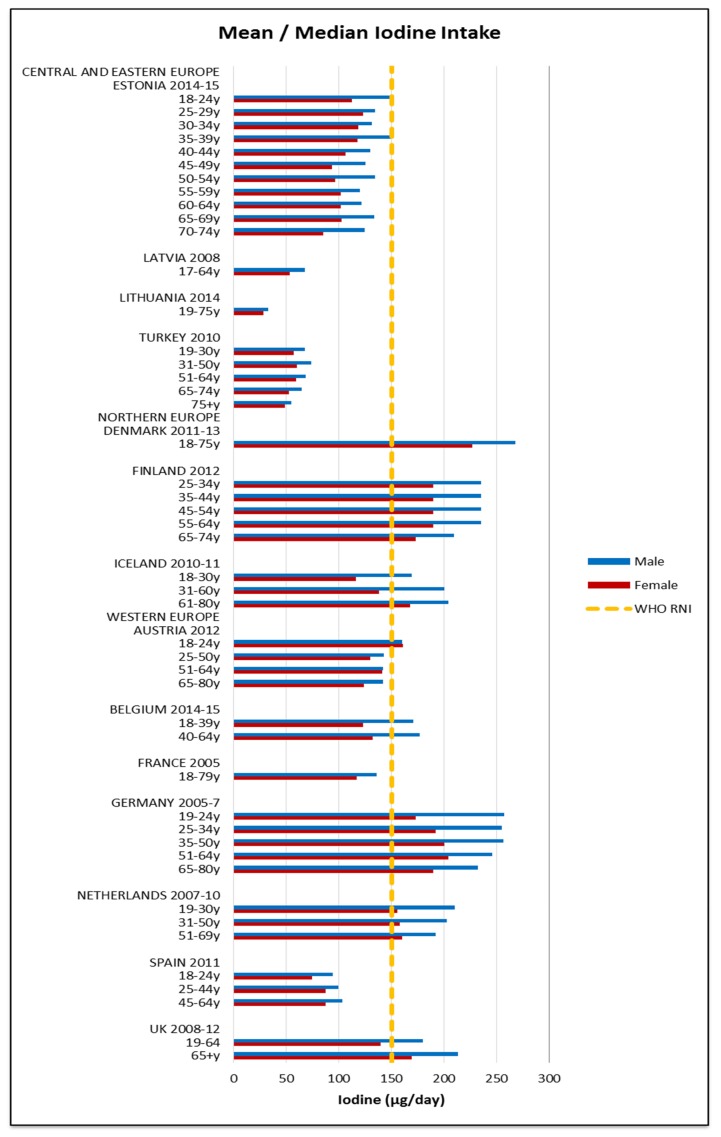
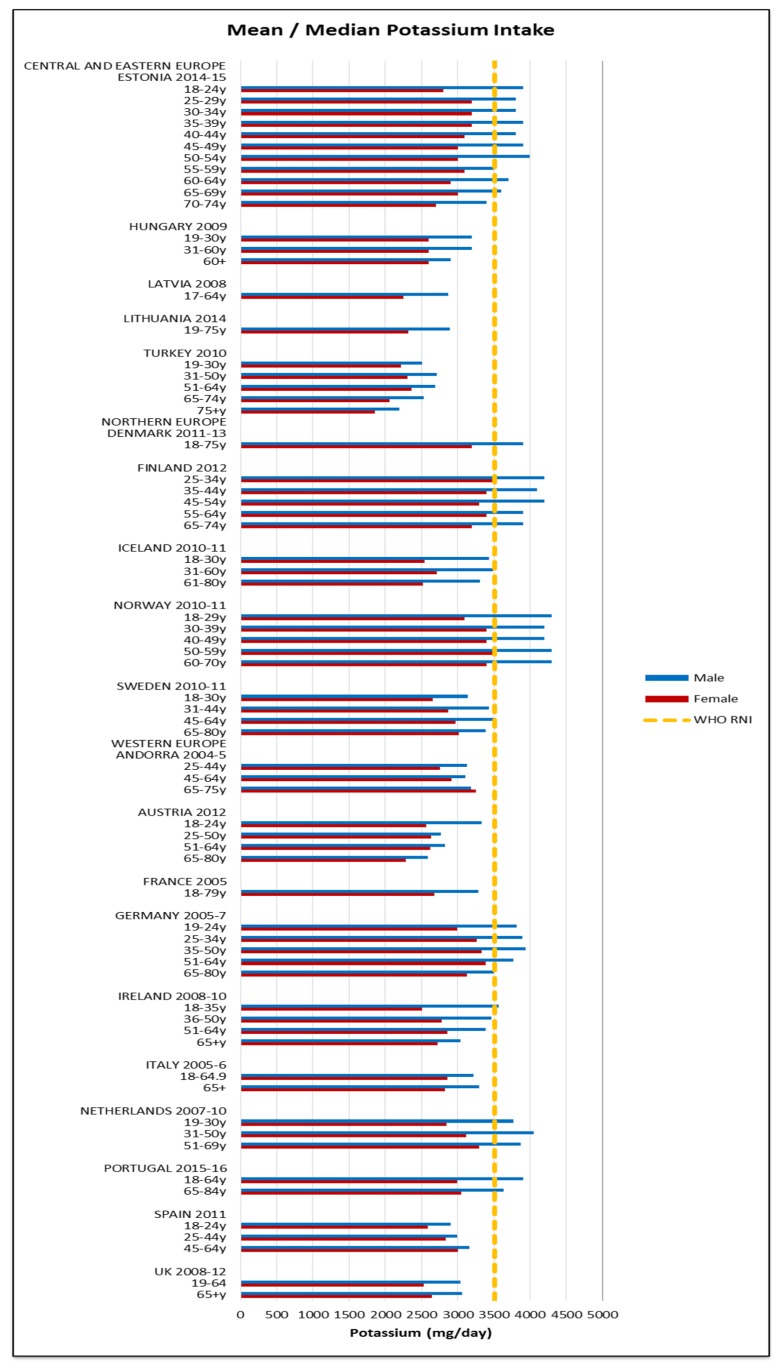
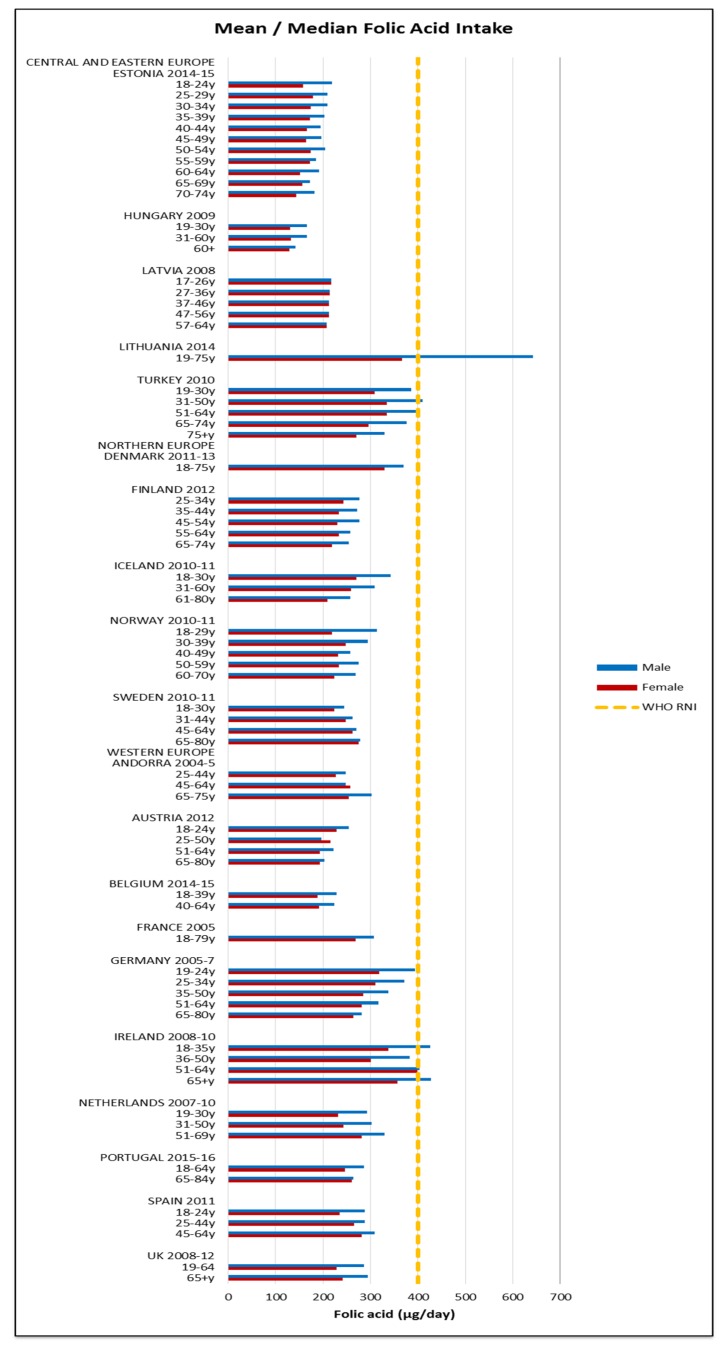
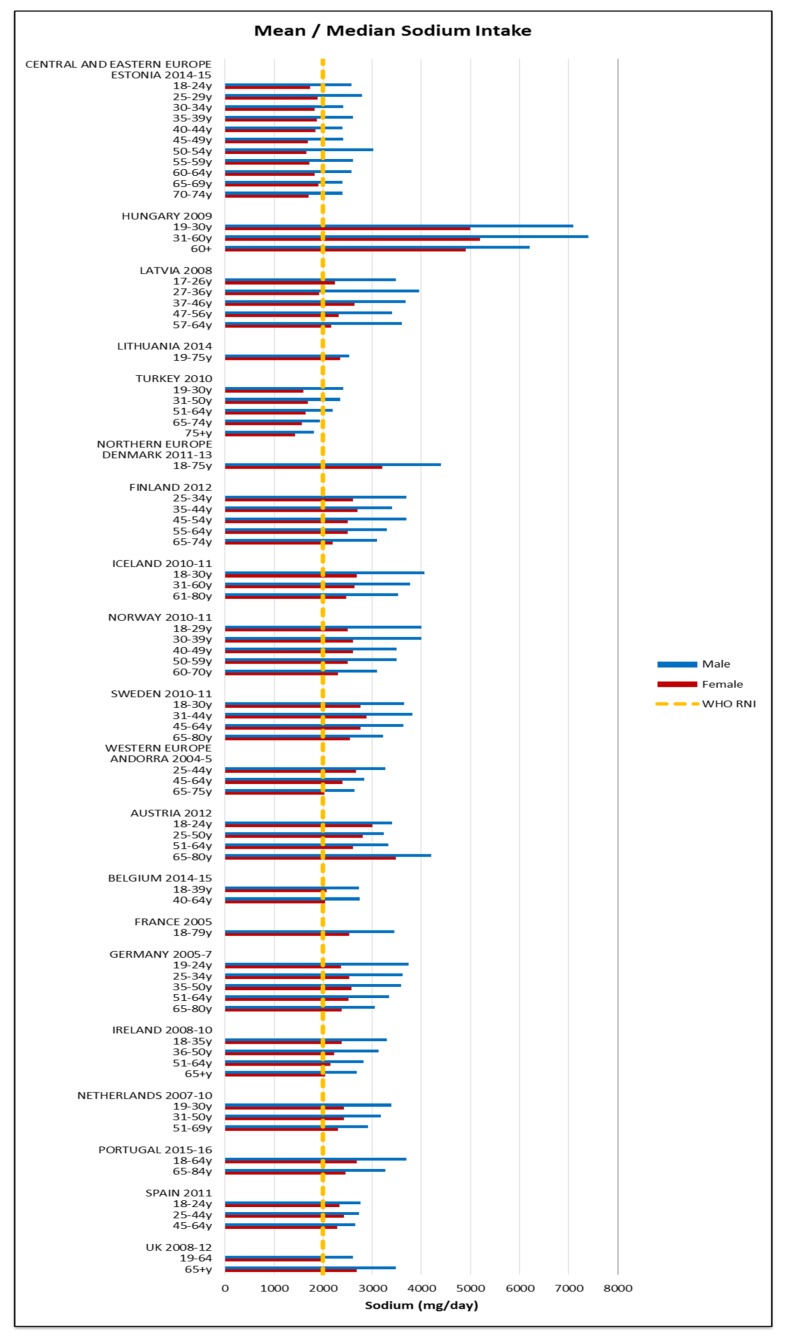
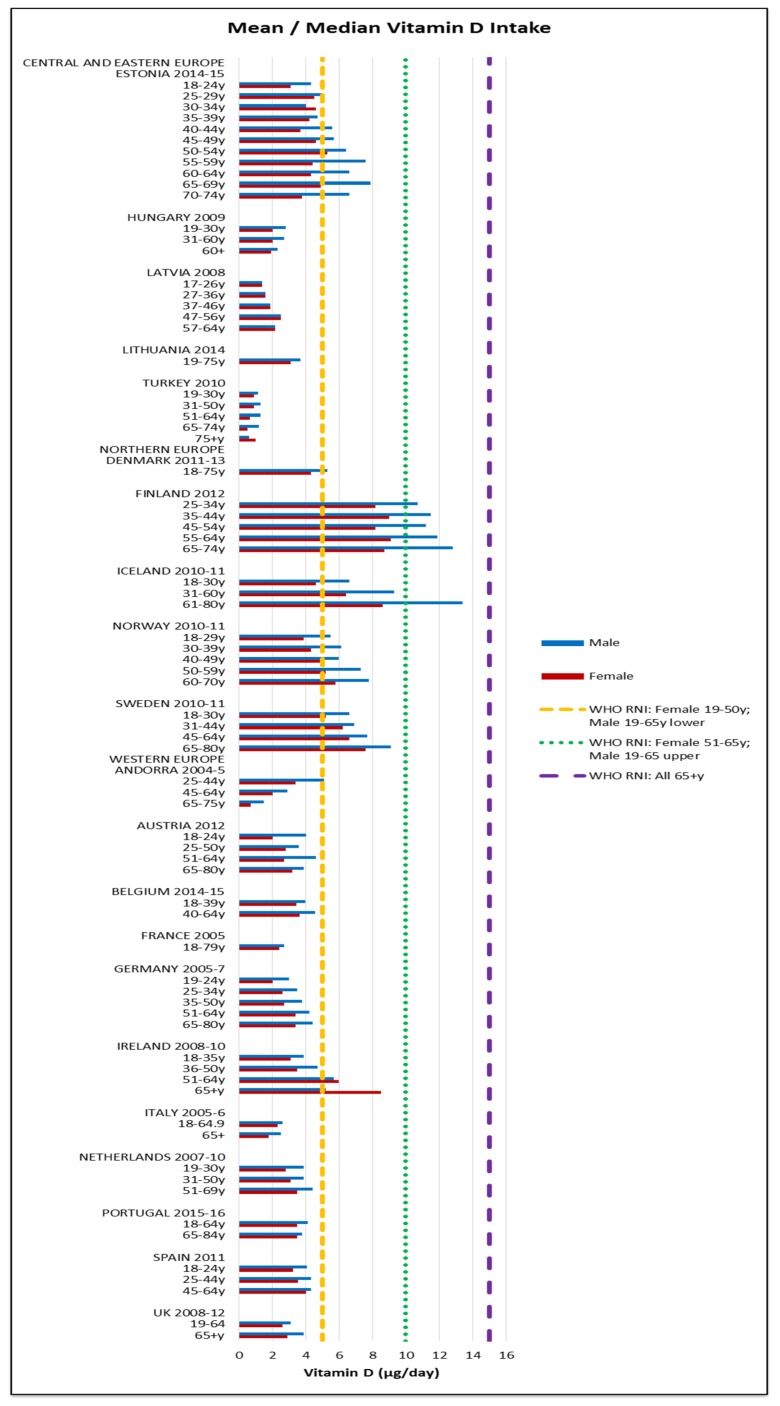
The World Health Organization (WHO) encourages countries to undertake national dietary survey (NDS) but implementation and reporting is inconsistent. This paper provides an up-to-date review of adult macro and micronutrient intakes in European populations as reported by NDS. It uses WHO Recommended Nutrient Intakes (RNIs) to assess intake adequacy and highlight areas of concern. NDS information was gathered primarily by internet searches and contacting survey authors and nutrition experts. Survey characteristics and adult intakes by gender/age group were extracted for selected nutrients and weighted means calculated by region. Of the 53 WHO Europe countries, over a third ( = 19), mainly Central & Eastern European countries (CEEC), had no identifiable NDS. Energy and nutrient intakes were extracted for 21 (40%) countries but differences in age group, methodology, under-reporting and nutrient composition databases hindered inter-country comparisons. No country met more than 39% WHO RNIs in all age/gender groups; macronutrient RNI achievement was poorer than micronutrient. Overall RNI attainment was slightly worse in CEEC and lower in women and female elderly. Only 40% countries provided adult energy and nutrient intakes. The main gaps lie in CEEC, where unknown nutrient deficiencies may occur. WHO RNI attainment was universally poor for macronutrients, especially for women, the female elderly and CEEC. All countries could be encouraged to report a uniform nutrient set and sub-analyses of nationally representative nutrient intakes.

摘要

世界卫生组织(WHO)鼓励各国开展国家饮食调查(NDS),但实施和报告情况不一致。本文最新综述了欧洲人群的成人宏观和微量营养素摄入量,这些数据来自 NDS 报告。本文使用世界卫生组织推荐的营养素摄入量(RNIs)评估摄入量是否充足,并强调需要关注的领域。NDS 信息主要通过互联网搜索以及联系调查作者和营养专家收集。针对选定的营养素,提取了调查特征和按性别/年龄组划分的成人摄入量,并按地区计算加权平均值。在 53 个世卫组织欧洲成员国中,超过三分之一(=19 个),主要是中东欧和东欧国家(CEEC),没有可识别的 NDS。有 21 个(40%)国家提取了能量和营养素摄入量,但由于年龄组、方法、低报和营养素组成数据库的差异,阻碍了国家间的比较。没有一个国家在所有年龄/性别组都达到了超过 39%的世卫组织 RNIs;宏量营养素的 RNI 实现情况不如微量营养素。CEEC 的整体 RNI 达标情况略差,女性和老年女性的情况更差。只有 40%的国家提供了成人的能量和营养素摄入量。主要的差距存在于 CEEC,这些国家可能存在未知的营养缺乏。对于宏量营养素,尤其是对于女性、老年女性和 CEEC,世卫组织 RNI 的达标情况普遍较差。所有国家都可以鼓励报告统一的营养素组和全国代表性营养素摄入量的亚分析。

https://cdn.ncbi.nlm.nih.gov/pmc/blobs/d550/5748739/3fccd4a0dc2e/nutrients-09-01288-g015.jpg
https://cdn.ncbi.nlm.nih.gov/pmc/blobs/d550/5748739/15f70a878c6d/nutrients-09-01288-g001.jpg
https://cdn.ncbi.nlm.nih.gov/pmc/blobs/d550/5748739/eab33058c1dd/nutrients-09-01288-g002.jpg
https://cdn.ncbi.nlm.nih.gov/pmc/blobs/d550/5748739/82ad98daf1d5/nutrients-09-01288-g003.jpg
https://cdn.ncbi.nlm.nih.gov/pmc/blobs/d550/5748739/970bf3b70d25/nutrients-09-01288-g004.jpg
https://cdn.ncbi.nlm.nih.gov/pmc/blobs/d550/5748739/7774f8d7f8b4/nutrients-09-01288-g005.jpg
https://cdn.ncbi.nlm.nih.gov/pmc/blobs/d550/5748739/549a38b5482a/nutrients-09-01288-g006.jpg
https://cdn.ncbi.nlm.nih.gov/pmc/blobs/d550/5748739/83a8f41b4d9f/nutrients-09-01288-g007.jpg
https://cdn.ncbi.nlm.nih.gov/pmc/blobs/d550/5748739/029566711892/nutrients-09-01288-g008.jpg
https://cdn.ncbi.nlm.nih.gov/pmc/blobs/d550/5748739/53a7f2d06c9c/nutrients-09-01288-g009.jpg
https://cdn.ncbi.nlm.nih.gov/pmc/blobs/d550/5748739/83bf11dbbd3a/nutrients-09-01288-g010.jpg
https://cdn.ncbi.nlm.nih.gov/pmc/blobs/d550/5748739/3f246a1f3b66/nutrients-09-01288-g011.jpg
https://cdn.ncbi.nlm.nih.gov/pmc/blobs/d550/5748739/488a09c16402/nutrients-09-01288-g012.jpg
https://cdn.ncbi.nlm.nih.gov/pmc/blobs/d550/5748739/840ebaf93c77/nutrients-09-01288-g013.jpg
https://cdn.ncbi.nlm.nih.gov/pmc/blobs/d550/5748739/363e6f0a7b16/nutrients-09-01288-g014.jpg
https://cdn.ncbi.nlm.nih.gov/pmc/blobs/d550/5748739/3fccd4a0dc2e/nutrients-09-01288-g015.jpg

相似文献

1
Adult Nutrient Intakes from Current National Dietary Surveys of European Populations.欧洲人群当前国家膳食调查中的成年人营养素摄入量。
Nutrients. 2017 Nov 27;9(12):1288. doi: 10.3390/nu9121288.
2
Child and adolescent nutrient intakes from current national dietary surveys of European populations.儿童和青少年从欧洲人群当前国家饮食调查中获得的营养摄入量。
Nutr Res Rev. 2019 Jun;32(1):38-69. doi: 10.1017/S0954422418000161. Epub 2018 Nov 3.
3
Assessing diet in European populations using national dietary surveys.利用全国饮食调查评估欧洲人群的饮食情况。
Proc Nutr Soc. 2020 Jan 23:1-11. doi: 10.1017/S0029665119001174.
4
Dietary intake and nutritional status of children and adolescents in Europe.欧洲儿童和青少年的饮食摄入与营养状况。
Br J Nutr. 2004 Oct;92 Suppl 2:S147-211. doi: 10.1079/bjn20041160.
5
Low Dietary Intakes of Essential Nutrients during Pregnancy in Vietnam.越南孕妇在怀孕期间必需营养素摄入量低。
Nutrients. 2018 Aug 6;10(8):1025. doi: 10.3390/nu10081025.
6
Nutrient intakes and compliance with nutrient recommendations in children aged 1-4 years in Ireland.爱尔兰 1-4 岁儿童的营养摄入量和营养建议遵守情况。
J Hum Nutr Diet. 2017 Oct;30(5):665-676. doi: 10.1111/jhn.12452. Epub 2017 Feb 2.
7
Dietary intake in pregnant women in a Spanish Mediterranean area: as good as it is supposed to be?西班牙地中海地区孕妇的饮食摄入:是否如预期般良好?
Public Health Nutr. 2013 Aug;16(8):1379-89. doi: 10.1017/S1368980012003643. Epub 2012 Aug 9.
8
Evaluation of older Chinese people's macronutrient intake status: results from the China Health and Nutrition Survey.中国老年人常量营养素摄入状况评估:来自中国健康与营养调查的结果
Br J Nutr. 2015 Jan 14;113(1):159-71. doi: 10.1017/S0007114514003444. Epub 2014 Nov 13.
9
Nutritional adequacy according to carbohydrates and fat quality.根据碳水化合物和脂肪质量评估营养充足度。
Eur J Nutr. 2016 Feb;55(1):93-106. doi: 10.1007/s00394-014-0828-3. Epub 2015 Jan 24.
10
Distribution of macro- and micronutrient intakes in relation to the meal pattern of third- and fourth-grade schoolchildren in the city of Quetzaltenango, Guatemala.危地马拉克萨尔特南戈市三、四年级学童的常量和微量营养素摄入量与用餐模式的关系
Public Health Nutr. 2009 Sep;12(9):1330-42. doi: 10.1017/S136898000800400X. Epub 2008 Dec 9.

引用本文的文献

1
Towards Healthy and Sustainable Diets: Understanding Food Consumption Trends in the EU.迈向健康与可持续饮食:了解欧盟的食物消费趋势
Foods. 2025 Aug 12;14(16):2798. doi: 10.3390/foods14162798.
2
Editorial: Preventing sarcopenia and promoting musculoskeletal health in middle-aged adults: the role of exercise and nutrition.社论:预防中年人的肌肉减少症并促进肌肉骨骼健康:运动和营养的作用
Front Sports Act Living. 2025 Apr 11;7:1601326. doi: 10.3389/fspor.2025.1601326. eCollection 2025.
3
Energy and Macronutrient Dietary Intakes of Serbian Adults 18-64 Years Old: EFSA EU Menu Food Consumption Survey in Serbia (2017-2022).

本文引用的文献

1
Comparison of high and low trans-fatty acid consumers: analyses of UK National Diet and Nutrition Surveys before and after product reformulation.高反式脂肪酸和低反式脂肪酸消费者的比较:英国国家饮食与营养调查在产品配方调整前后的分析。
Public Health Nutr. 2018 Feb;21(3):465-479. doi: 10.1017/S1368980017002877. Epub 2017 Nov 21.
2
Protocol of the Belgian food consumption survey 2014: objectives, design and methods.2014年比利时食品消费调查方案:目标、设计与方法
Arch Public Health. 2016 May 16;74:20. doi: 10.1186/s13690-016-0131-2. eCollection 2016.
3
Dietary fat intakes in Irish adults in 2011: how much has changed in 10 years?
18至64岁塞尔维亚成年人的能量和常量营养素膳食摄入量:塞尔维亚的欧洲食品安全局欧盟菜单食品消费调查(2017 - 2022年)
Foods. 2025 Mar 31;14(7):1228. doi: 10.3390/foods14071228.
4
Diversity of dietary protein patterns across Europe - Impact on nutritional quality and environmental sustainability.欧洲各地膳食蛋白质模式的多样性——对营养质量和环境可持续性的影响。
Curr Res Food Sci. 2025 Mar 4;10:101019. doi: 10.1016/j.crfs.2025.101019. eCollection 2025.
5
Assessment of Micro- and Macronutrient Intake in Male Competitive Athletes Using the Epic-Norfolk Food Frequency Questionnaire.使用诺福克饮食频率问卷对男性竞技运动员的微量和宏量营养素摄入量进行评估。
Life (Basel). 2025 Mar 13;15(3):458. doi: 10.3390/life15030458.
6
"Gut" to grips with the science of the microbiome - a symposium report.《“肠道”深入探究微生物组学——研讨会报告》
Gut Microbiome (Camb). 2024 Nov 29;5:e11. doi: 10.1017/gmb.2024.8. eCollection 2024.
7
Intakes of energy, macronutrients, and micronutrients in adult Lithuanian population: a national study of 2019-2020.2019-2020 年立陶宛成年人的能量、宏量营养素和微量营养素摄入量:一项全国性研究。
J Nutr Sci. 2024 Sep 23;13:e46. doi: 10.1017/jns.2024.40. eCollection 2024.
8
Closing the Fibre Gap-The Impact of Combination of Soluble and Insoluble Dietary Fibre on Bread Quality and Health Benefits.缩小纤维差距——可溶性与不可溶性膳食纤维组合对面包品质及健康益处的影响
Foods. 2024 Jun 24;13(13):1980. doi: 10.3390/foods13131980.
9
Dietary fibre intake and its association with ultraprocessed food consumption in the general population of Switzerland: analysis of a population-based, cross-sectional national nutrition survey.瑞士普通人群膳食纤维摄入量及其与超加工食品消费的关联:基于人群的全国性横断面营养调查分析
BMJ Nutr Prev Health. 2024 Jan 16;7(1):26-37. doi: 10.1136/bmjnph-2023-000727. eCollection 2024.
10
Cross-continental national nutrition surveys: a narrative review.跨大陆国家营养调查:一项叙述性综述。
BMC Nutr. 2024 Apr 22;10(1):63. doi: 10.1186/s40795-024-00868-4.
2011年爱尔兰成年人的膳食脂肪摄入量:10年间有何变化?
Br J Nutr. 2016 May 28;115(10):1798-809. doi: 10.1017/S0007114516000787. Epub 2016 Mar 21.
4
Assessment of dietary lutein, zeaxanthin and lycopene intakes and sources in the Spanish survey of dietary intake (2009-2010).西班牙饮食摄入量调查(2009 - 2010年)中膳食叶黄素、玉米黄质和番茄红素摄入量及来源的评估。
Int J Food Sci Nutr. 2016;67(3):305-13. doi: 10.3109/09637486.2016.1147020. Epub 2016 Feb 22.
5
Denmark's Policy on Artificial Trans Fat and Cardiovascular Disease.丹麦关于人造反式脂肪与心血管疾病的政策。
Am J Prev Med. 2016 Jan;50(1):69-76. doi: 10.1016/j.amepre.2015.06.018. Epub 2015 Aug 28.
6
Assessing global dietary habits: a comparison of national estimates from the FAO and the Global Dietary Database.评估全球饮食习惯:粮农组织与全球饮食数据库国家估计值的比较
Am J Clin Nutr. 2015 May;101(5):1038-46. doi: 10.3945/ajcn.114.087403. Epub 2015 Mar 18.
7
Dietary quality among men and women in 187 countries in 1990 and 2010: a systematic assessment.1990 年和 2010 年 187 个国家的男性和女性饮食质量:系统评估。
Lancet Glob Health. 2015 Mar;3(3):e132-42. doi: 10.1016/S2214-109X(14)70381-X.
8
[National nutrition surveys and dietary changes in Iceland. Economic differences in healthy eating].[冰岛的全国营养调查与饮食变化。健康饮食方面的经济差异]
Laeknabladid. 2014 Dec;100(12):659-64. doi: 10.17992/lbl.2014.12.571.
9
Global, regional, and national consumption levels of dietary fats and oils in 1990 and 2010: a systematic analysis including 266 country-specific nutrition surveys.1990 年和 2010 年全球、区域和国家的膳食脂肪和油消费水平:包括 266 个国家具体营养调查的系统分析。
BMJ. 2014 Apr 15;348:g2272. doi: 10.1136/bmj.g2272.
10
Salt reduction in the United Kingdom: a successful experiment in public health.英国的减盐行动:一次成功的公共卫生实验。
J Hum Hypertens. 2014 Jun;28(6):345-52. doi: 10.1038/jhh.2013.105. Epub 2013 Oct 31.