From the Division of Epidemiology, Department of Medicine (M.A.M., T.G., M.M.) and Department of Nutrition and Integrative Physiology (P.M.G.), University of Utah, Salt Lake City; Department of Medicine, New York University School of Medicine (J.M.B.); Welch Center for Prevention, Epidemiology and Clinical Research, Johns Hopkins University, Baltimore, MD (L.J.A.); and Department of Biostatistical Sciences, Wake Forest School of Medicine, Winston-Salem, NC (J.A.T.).
Hypertension. 2018 May;71(5):858-865. doi: 10.1161/HYPERTENSIONAHA.117.10602. Epub 2018 Mar 19.
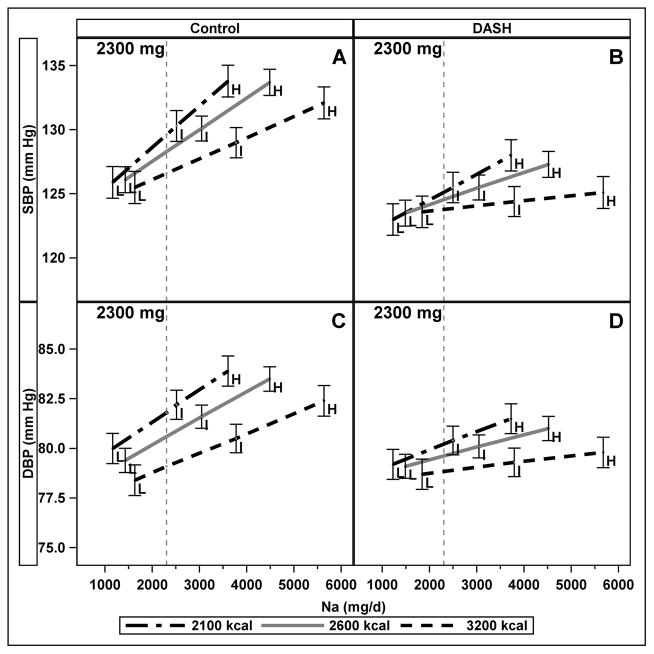
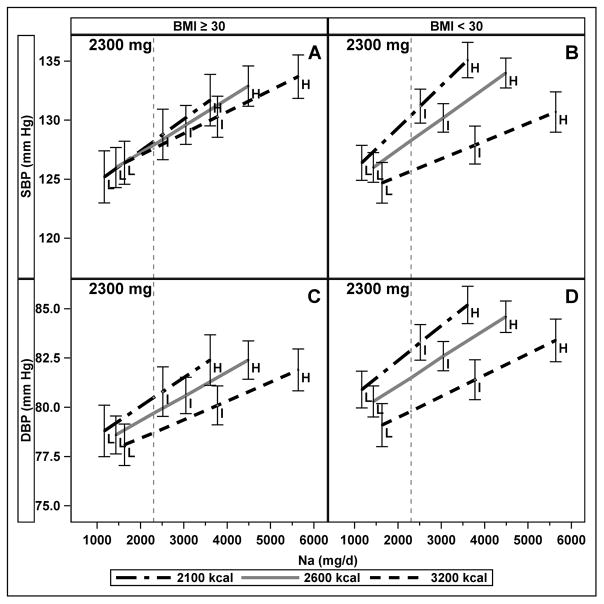
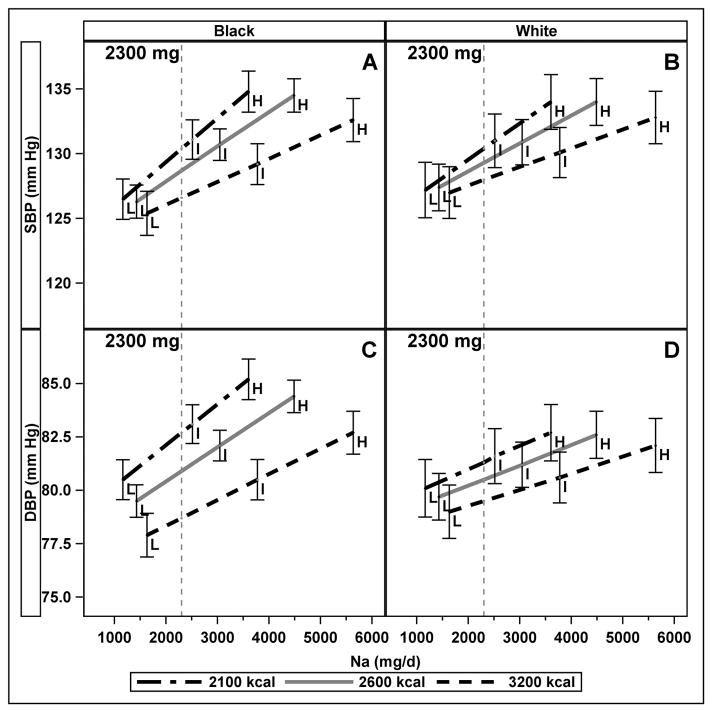
Dietary Na recommendations are expressed as absolute amounts (mg/d) rather than as Na density (mg/kcal). Our objective was to determine whether the strength of the relationship of Na intake with blood pressure (BP) varied with energy intake. The DASH (Dietary Approaches to Stop Hypertension)-Sodium trial was a randomized feeding trial comparing 2 diets (DASH and control) and 3 levels of Na density. Participants with pre- or stage 1 hypertension consumed diets for 30 days in random order; energy intake was controlled to maintain body weight. This secondary analysis of 379 non-Hispanic black and white participants used mixed-effects models to assess the association of Na and energy intakes with BP. The relationships between absolute Na and both systolic and diastolic BP varied with energy intake. BP rose more steeply with increasing Na at lower energy intake than at higher energy intake ( interaction<0.001). On the control diet with 2300 mg Na, both systolic and diastolic BP were higher (3.0 mm Hg; 95% confidence interval, 0.2-5.8; and 2.7 mm Hg; 95% confidence interval, 1.0-4.5, respectively) among those with lower energy intake (higher Na density) than among those with higher energy intake (lower Na density). The association of Na with systolic BP was stronger at lower levels of energy intake in both blacks and whites (<0.001). The association of Na and diastolic BP varied with energy intake only among blacks (=0.001). Sodium density should be considered as a metric for expressing dietary Na recommendations.
膳食钠推荐摄入量以绝对量(mg/d)表示,而不是以钠密度(mg/千卡)表示。我们的目的是确定钠摄入量与血压(BP)的关系强度是否随能量摄入而变化。DASH(停止高血压的饮食方法)-钠试验是一项随机喂养试验,比较了 2 种饮食(DASH 和对照)和 3 种钠密度水平。患有前期或 1 期高血压的参与者以随机顺序进食这些饮食 30 天;通过控制能量摄入来维持体重。这项对 379 名非西班牙裔黑人和白人参与者的二次分析使用混合效应模型来评估钠和能量摄入与 BP 的关联。绝对钠与收缩压和舒张压之间的关系随能量摄入而变化。在较低的能量摄入下,随着钠摄入量的增加,血压升高得更陡峭,而在较高的能量摄入下则不然(交互作用<0.001)。在摄入 2300 毫克钠的对照饮食中,与能量摄入较高者相比,能量摄入较低者(钠密度较高者)的收缩压(3.0 毫米汞柱;95%置信区间,0.2-5.8;和 2.7 毫米汞柱;95%置信区间,1.0-4.5)和舒张压(分别)更高。在黑人(<0.001)和白人(<0.001)中,能量摄入较低时,钠与收缩压的关联更强。钠与舒张压的关联仅在黑人中随能量摄入而变化(=0.001)。钠密度应被视为表示膳食钠推荐摄入量的指标。