Department of Computer Science, University of British Columbia, Vancouver, Canada.
School of Population and Public Health, University of British Columbia, Vancouver, Canada.
Bioinformatics. 2019 May 15;35(10):1668-1676. doi: 10.1093/bioinformatics/bty832.
Data visualization is an important tool for exploring and communicating findings from genomic and healthcare datasets. Yet, without a systematic way of organizing and describing the design space of data visualizations, researchers may not be aware of the breadth of possible visualization design choices or how to distinguish between good and bad options.
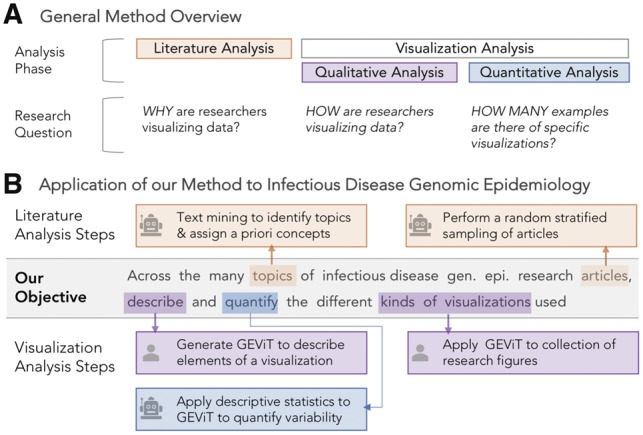
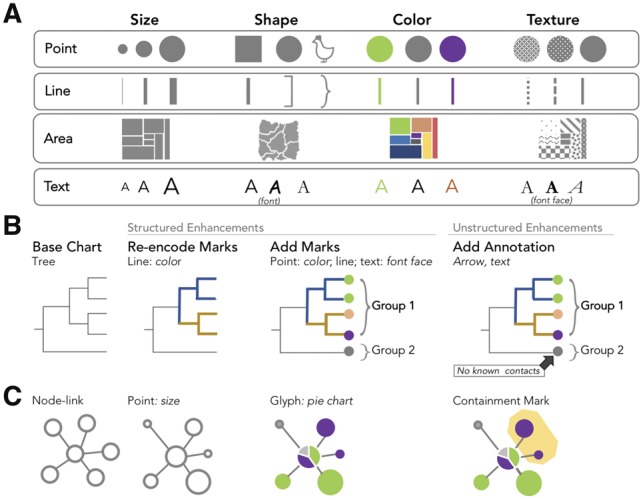
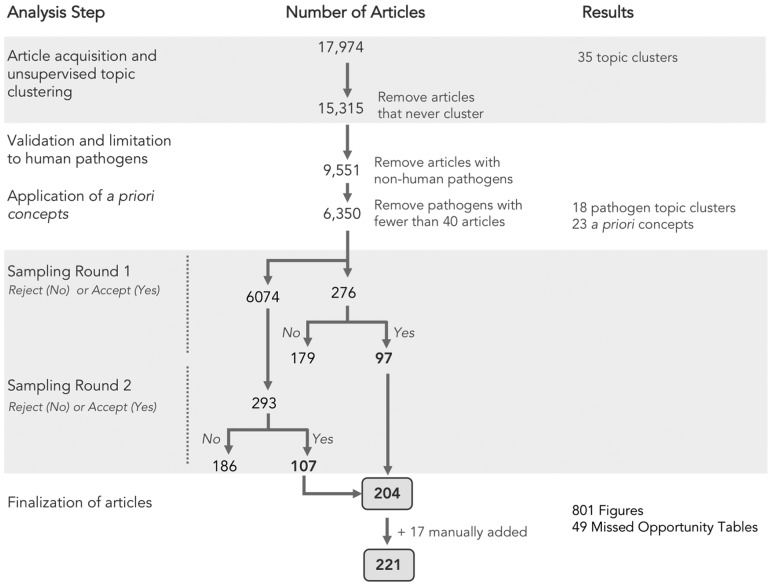
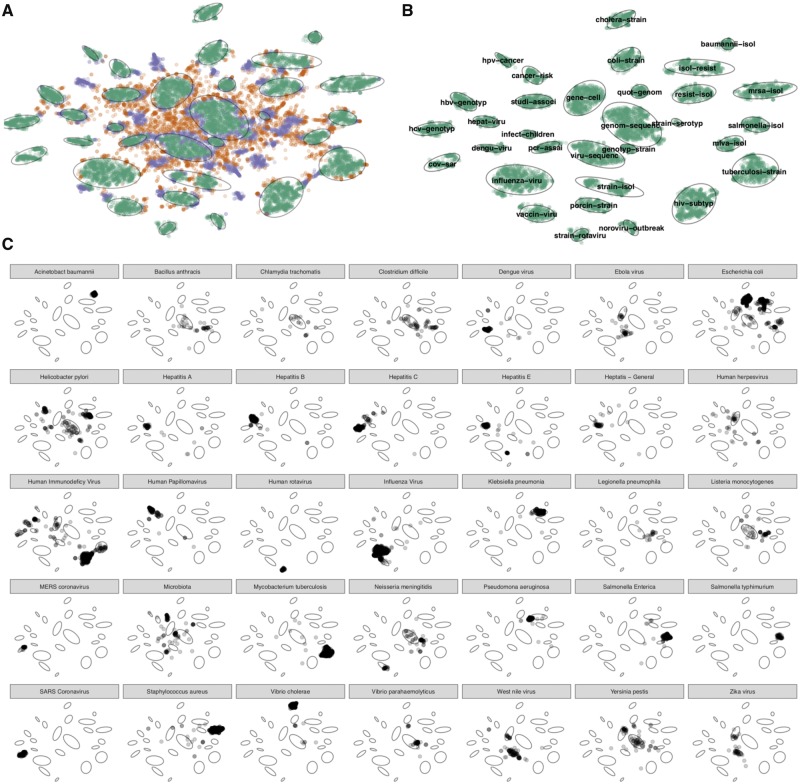
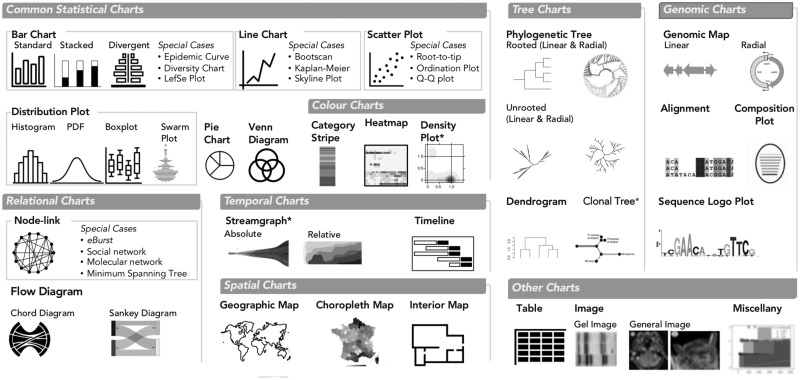
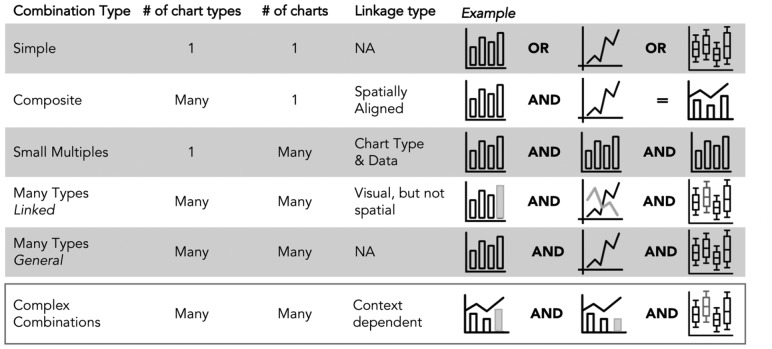
We have developed a method that systematically surveys data visualizations using the analysis of both text and images. Our method supports the construction of a visualization design space that is explorable along two axes: why the visualization was created and how it was constructed. We applied our method to a corpus of scientific research articles from infectious disease genomic epidemiology and derived a Genomic Epidemiology Visualization Typology (GEViT) that describes how visualizations were created from a series of chart types, combinations and enhancements. We have also implemented an online gallery that allows others to explore our resulting design space of visualizations. Our results have important implications for visualization design and for researchers intending to develop or use data visualization tools. Finally, the method that we introduce is extensible to constructing visualizations design spaces across other research areas.
Our browsable gallery is available at http://gevit.net and all project code can be found at https://github.com/amcrisan/gevitAnalysisRelease.
Supplementary data are available at Bioinformatics online.
数据可视化是探索和交流基因组学和医疗保健数据集结果的重要工具。然而,如果没有系统的方法来组织和描述数据可视化的设计空间,研究人员可能不知道可能的可视化设计选择的范围,也不知道如何区分好的和坏的选项。
我们开发了一种使用文本和图像分析来系统地调查数据可视化的方法。我们的方法支持构建一个可沿着两个轴探索的可视化设计空间:创建可视化的原因和构建可视化的方式。我们将我们的方法应用于传染病基因组流行病学的科学研究文章语料库,并得出了一个描述如何从一系列图表类型、组合和增强中创建可视化的基因组流行病学可视化分类法(GEViT)。我们还实现了一个在线画廊,允许其他人探索我们的可视化设计空间。我们的结果对可视化设计以及打算开发或使用数据可视化工具的研究人员具有重要意义。最后,我们引入的方法可扩展到构建其他研究领域的可视化设计空间。
我们可浏览的画廊可在 http://gevit.net 上访问,所有项目代码都可以在 https://github.com/amcrisan/gevitAnalysisRelease 上找到。
补充数据可在《生物信息学》在线获取。