Joshi Ankur, Mitra Arun, Anjum Nikhat, Shrivastava Neelesh, Khadanga Sagar, Pakhare Abhijit, Joshi Rajnish
Department of Community and Family Medicine, All India Institute of Medical Sciences (AIIMS), Bhopal 462020 India.
Hospital Services, All India Institute of Medical Sciences, Bhopal 462020, India.
Med Sci (Basel). 2019 Mar 25;7(3):52. doi: 10.3390/medsci7030052.
Variations in blood glucose levels over a given time interval is termed as glycemic variability (GV). Higher GV is associated with higher diabetes-related complications. The current study was done with the aim of detecting the sensitivity of various GV indices among individuals with type 2 diabetes mellitus of different glycemic control status.
We performed a longitudinal study among individuals with type 2 diabetes mellitus (T2DM) who were participating in a two-week diabetes self-management education (DSME) program. Participants were categorized by their HbA1c as poor (≥8%), acceptable (7%⁻8%), and optimal control (<7%). Continuous glucose monitoring (CGM) sensors recorded interstitial glucose every 15 min from day 1. The evaluated GV measures include standard deviation (SD), coefficient of variation (CV), mean amplitude of glycemic excursion (MAGE), continuous overlapping net glycemic action (CONGA), mean of daily difference for inter-day variation (MODD), high blood glucose index (HBGI), and low blood glucose index (LBGI).
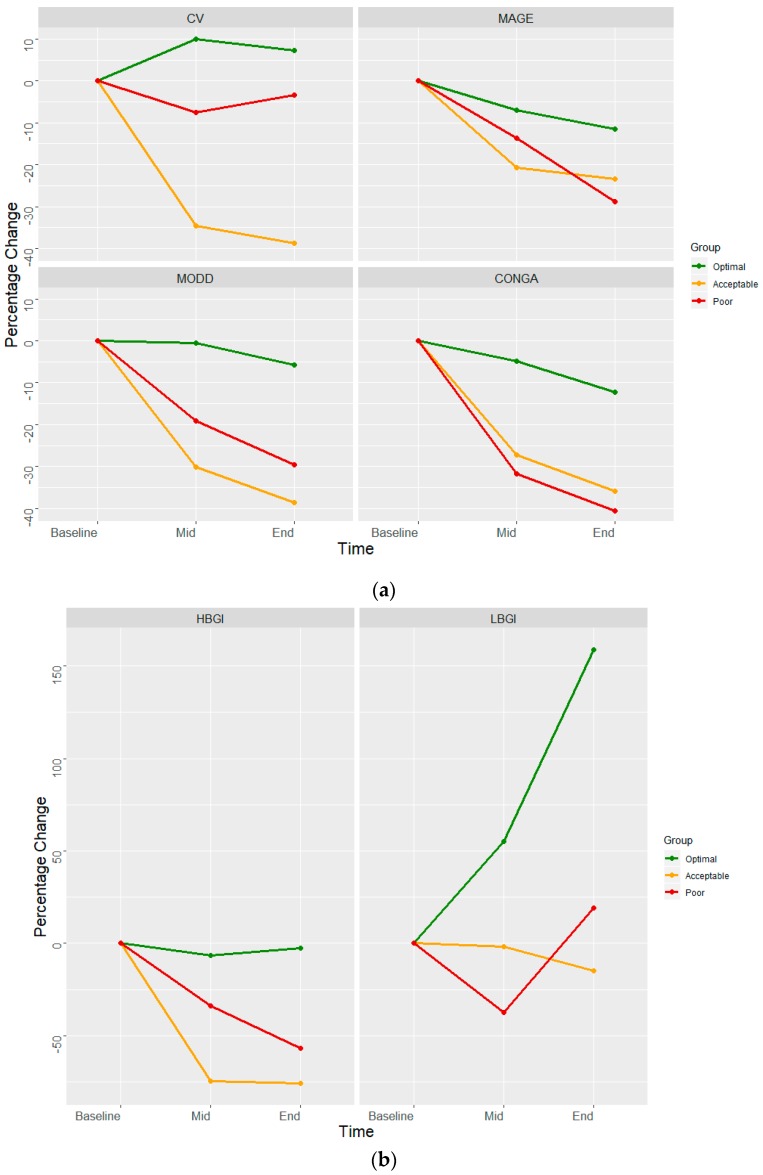
A total of 41 study participants with 46347 CGM values were available for analysis. Of 41 participants, 20 (48.7%) were in the poor, 10 (24.3%) in the acceptable, and 11 (26.8%) in the optimal control group. The GV indices (SD; CV; MODD; MAGE; CONGA; HBGI) of poorly controlled (77.43; 38.02; 45.82; 216.63; 14.10; 16.62) were higher than acceptable (50.02; 39.32; 30.79; 138.01; 8.87; 5.56) and optimal (34.15; 29.46; 24.56; 126.15; 8.67; 3.13) control group. Glycemic variability was reduced in the poorly and acceptably controlled groups by the end of the 2-week period. There was a rise in LBGI in the optimally controlled group, indicating pitfalls of tight glycemic control.
Indices of glycemic variability are useful complements, and changes in it can be demonstrated within short periods.
在给定时间间隔内血糖水平的变化被称为血糖变异性(GV)。较高的血糖变异性与较高的糖尿病相关并发症有关。本研究旨在检测不同血糖控制状态的2型糖尿病患者中各种血糖变异性指标的敏感性。
我们对参加为期两周糖尿病自我管理教育(DSME)项目的2型糖尿病(T2DM)患者进行了一项纵向研究。参与者根据糖化血红蛋白(HbA1c)分为控制不佳(≥8%)、可接受(7%⁻8%)和最佳控制(<7%)组。从第1天起,连续血糖监测(CGM)传感器每15分钟记录一次组织间液葡萄糖。评估的血糖变异性指标包括标准差(SD)、变异系数(CV)、血糖波动幅度均值(MAGE)、连续重叠血糖净作用(CONGA)、日间血糖波动平均日差值(MODD)、高血糖指数(HBGI)和低血糖指数(LBGI)。
共有41名研究参与者的46347个CGM值可供分析。在41名参与者中,20名(48.7%)属于控制不佳组,10名(24.3%)属于可接受组,11名(26.8%)属于最佳控制组。控制不佳组的血糖变异性指标(SD;CV;MODD;MAGE;CONGA;HBGI)(分别为77.43;38.02;45.82;216.63;14.10;16.62)高于可接受组(分别为50.02;39.32;30.79;138.01;8.87;5.56)和最佳控制组(分别为34.15;29.46;24.56;126.15;8.67;3.13)。在为期2周的研究结束时,控制不佳组和可接受组的血糖变异性降低。最佳控制组的低血糖指数上升,表明严格血糖控制存在缺陷。
血糖变异性指标是有用的补充指标,且在短时间内即可显示其变化。