JC School of Public Health and Primary Care, Chinese University of Hong Kong, Hong Kong, China; Shenzhen Research Institute of Chinese University of Hong Kong, Shenzhen, China.
Michigan Institute for Data Science, University of Michigan, Ann Arbor, MI, USA.
Int J Infect Dis. 2020 Mar;92:214-217. doi: 10.1016/j.ijid.2020.01.050. Epub 2020 Jan 30.
An ongoing outbreak of a novel coronavirus (2019-nCoV) pneumonia hit a major city in China, Wuhan, December 2019 and subsequently reached other provinces/regions of China and other countries. We present estimates of the basic reproduction number, R, of 2019-nCoV in the early phase of the outbreak.
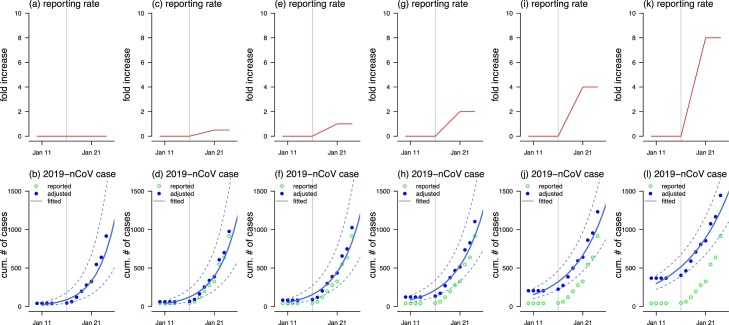
Accounting for the impact of the variations in disease reporting rate, we modelled the epidemic curve of 2019-nCoV cases time series, in mainland China from January 10 to January 24, 2020, through the exponential growth. With the estimated intrinsic growth rate (γ), we estimated R by using the serial intervals (SI) of two other well-known coronavirus diseases, MERS and SARS, as approximations for the true unknown SI.
The early outbreak data largely follows the exponential growth. We estimated that the mean R ranges from 2.24 (95%CI: 1.96-2.55) to 3.58 (95%CI: 2.89-4.39) associated with 8-fold to 2-fold increase in the reporting rate. We demonstrated that changes in reporting rate substantially affect estimates of R.
The mean estimate of R for the 2019-nCoV ranges from 2.24 to 3.58, and is significantly larger than 1. Our findings indicate the potential of 2019-nCoV to cause outbreaks.
2019 年新型冠状病毒(2019-nCoV)肺炎疫情于 2019 年 12 月在中国武汉市爆发,并随后蔓延至中国其他省份/地区以及其他国家。我们报告了 2019-nCoV 在疫情早期的基本繁殖数 R 的估计值。
考虑到疾病报告率的变化的影响,我们通过指数增长对 2019 年 1 月 10 日至 1 月 24 日期间中国大陆 2019-nCoV 病例时间序列的流行曲线进行建模。根据估计的内在增长率(γ),我们使用两种已知冠状病毒疾病(中东呼吸综合征和严重急性呼吸综合征)的序列间隔(SI)来估算 R,作为对真实未知 SI 的近似值。
早期疫情数据基本符合指数增长。我们估计平均 R 值范围在 2.24(95%CI:1.96-2.55)到 3.58(95%CI:2.89-4.39)之间,这与报告率增加 8 倍到 2 倍有关。我们表明,报告率的变化会极大地影响 R 的估计值。
2019-nCoV 的平均 R 值估计范围在 2.24 到 3.58 之间,显著大于 1。我们的研究结果表明,2019-nCoV 有引发疫情的潜力。