University of Illinois Chicago, Department of Kinesiology and Nutrition, 1919 West Taylor Street, MC 517, Chicago IL, 60612, USA.
Scand J Work Environ Health. 2021 Apr 1;47(3):171-180. doi: 10.5271/sjweh.3939. Epub 2020 Dec 7.
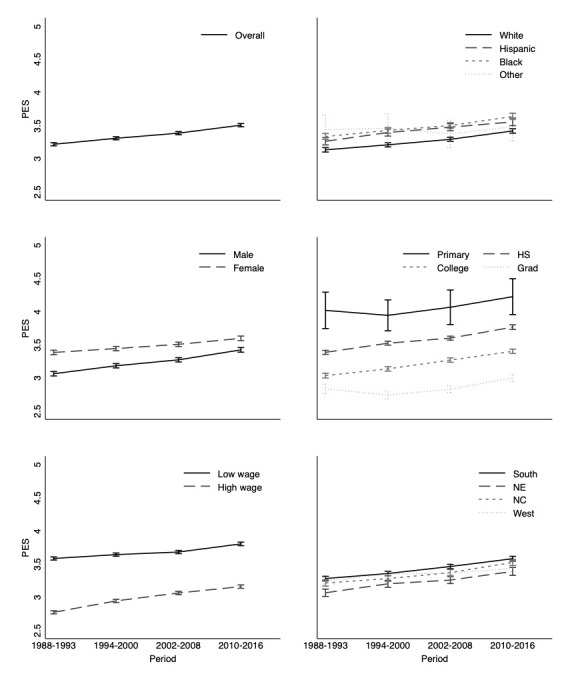
Objective This longitudinal study aimed to measure precarious employment in the US using a multidimensional indicator. Methods We used data from the National Longitudinal Survey of Youth (1988-2016) and the Occupational Information Network database to create a longitudinal precarious employment score (PES) among 7568 employed individuals over 18 waves (N=101 290 observations). We identified 13 survey indicators to operationalize 7 dimensions of precarious employment, which we included in our PES (range: 0-7, with 7 indicating the most precarious): material rewards, working-time arrangements, stability, workers' rights, collective organization, interpersonal relations, and training. Using generalized estimating equations, we estimated the mean PES and changes over time in the PES overall and by race/ethnicity, gender, education, income, and region. Results On average, the PES was 3.17 [standard deviation (SD) 1.19], and was higher among women (3.34, SD 1.20), people of color (Hispanics: 3.24, SD 1.23; non-Hispanic Blacks: 3.31, SD 1.23), those with less education (primary: 3.99, SD 1.07; high school: 3.43, SD 1.19), and with lower-incomes (3.84, SD 1.08), and those residing in the South (3.23, SD 1.17). From 1988 to 2016, the PES increased by 9% on average [0.29 points; 95% confidence interval (CI) 0.26-0.31]. While precarious employment increased over time across all subgroups, the increase was largest among males (0.35 points; 95% CI 0.33-0.39), higher-income (0.39 points; 95% CI 0.36-0.42) and college-educated (0.37 points; 95% CI 0.33-0.41) individuals. Conclusions Long-term decreases in employment quality are widespread in the US. Women and those from racialized and less-educated populations remain disproportionately precariously employed; however, we observed the largest increases among men, college graduates and higher-income individuals.
本纵向研究旨在使用多维指标来衡量美国的不稳定就业情况。
我们使用了国家青年纵向调查(1988-2016 年)和职业信息网络数据库的数据,在 18 个波次中创建了 7568 名在职人员的纵向不稳定就业评分(PES)(N=101290 次观察)。我们确定了 13 个调查指标,以将不稳定就业的 7 个维度具体化,这些维度都包含在我们的 PES 中(范围为 0-7,7 表示最不稳定):物质奖励、工作时间安排、稳定性、工人权利、集体组织、人际关系和培训。使用广义估计方程,我们估计了总体 PES 以及按种族/民族、性别、教育程度、收入和地区划分的 PES 随时间的变化。
平均而言,PES 为 3.17(标准差 [SD] 为 1.19),女性(3.34,SD 为 1.20)、有色人种(西班牙裔:3.24,SD 为 1.23;非西班牙裔黑人:3.31,SD 为 1.23)、受教育程度较低者(小学:3.99,SD 为 1.07;高中:3.43,SD 为 1.19)和收入较低者(3.84,SD 为 1.08)的 PES 较高,以及居住在南部的人(3.23,SD 为 1.17)。从 1988 年到 2016 年,PES 平均增长了 9%[0.29 点;95%置信区间(CI)为 0.26-0.31]。虽然所有亚组的不稳定就业状况随时间推移而增加,但男性(0.35 点;95%CI 为 0.33-0.39)、高收入者(0.39 点;95%CI 为 0.36-0.42)和受过大学教育者(0.37 点;95%CI 为 0.33-0.41)的增幅最大。
美国就业质量的长期下降现象普遍存在。女性和来自种族化和受教育程度较低人群的人仍然不成比例地从事不稳定工作;然而,我们观察到男性、大学毕业生和高收入人群的增幅最大。