Division of Biostatistics, Department of Public Health Sciences, Medical University of South Carolina, Charleston, South Carolina; Charleston VA Health Equity and Rural Outreach Innovation Center (HEROIC), Ralph H. Johnson VA Medical Center, Charleston, South Carolina.
Division of Biostatistics, Department of Public Health Sciences, Medical University of South Carolina, Charleston, South Carolina.
Am J Prev Med. 2021 Jul;61(1):115-119. doi: 10.1016/j.amepre.2021.01.034. Epub 2021 Mar 10.
The response to the COVID-19 pandemic became increasingly politicized in the U.S., and the political affiliation of state leaders may contribute to policies affecting the spread of the disease. This study examines the differences in COVID-19 infection, death, and testing by governor party affiliation across the 50 U.S. states and the District of Columbia.
A longitudinal analysis was conducted in December 2020 examining COVID-19 incidence, death, testing, and test positivity rates from March 15, 2020 through December 15, 2020. A Bayesian negative binomial model was fit to estimate the daily risk ratios and posterior intervals comparing rates by gubernatorial party affiliation. The analyses adjusted for state population density, rurality, Census region, age, race, ethnicity, poverty, number of physicians, obesity, cardiovascular disease, asthma, smoking, and presidential voting in 2020.
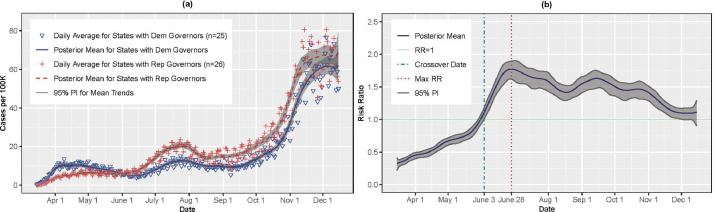
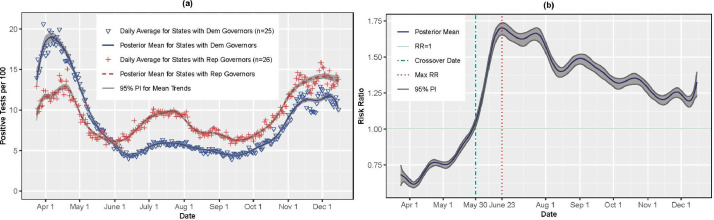
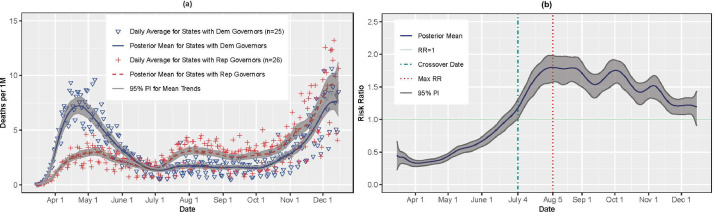
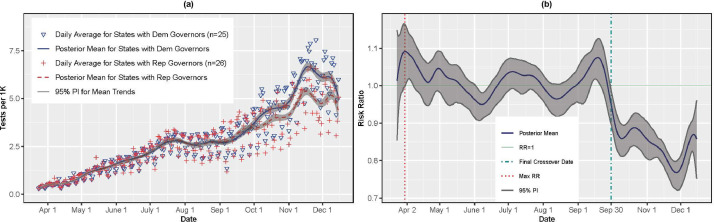
From March 2020 to early June 2020, Republican-led states had lower COVID-19 incidence rates than Democratic-led states. On June 3, 2020, the association reversed, and Republican-led states had a higher incidence (risk ratio=1.10, 95% posterior interval=1.01, 1.18). This trend persisted through early December 2020. For death rates, Republican-led states had lower rates early in the pandemic but higher rates from July 4, 2020 (risk ratio=1.18, 95% posterior interval=1.02, 1.31) through mid-December 2020. Republican-led states had higher test positivity rates starting on May 30, 2020 (risk ratio=1.70, 95% posterior interval=1.66, 1.73) and lower testing rates by September 30, 2020 (risk ratio=0.95, 95% posterior interval=0.90, 0.98).
Gubernatorial party affiliation may drive policy decisions that impact COVID-19 infections and deaths across the U.S. Future policy decisions should be guided by public health considerations rather than by political ideology.
在美国,对 COVID-19 大流行的反应变得越来越政治化,而州领导人的政治派别可能会影响影响疾病传播的政策。本研究考察了美国 50 个州和哥伦比亚特区的 COVID-19 感染、死亡和检测情况因州长党派关系的不同而产生的差异。
2020 年 12 月进行了一项纵向分析,研究了 2020 年 3 月 15 日至 2020 年 12 月 15 日期间的 COVID-19 发病率、死亡率、检测率和检测阳性率。使用贝叶斯负二项式模型来估计按州长党派关系比较比率的每日风险比和后验区间。分析调整了州人口密度、农村程度、人口普查区、年龄、种族、族裔、贫困、医生人数、肥胖、心血管疾病、哮喘、吸烟和 2020 年总统投票情况。
从 2020 年 3 月到 2020 年 6 月初,共和党领导的州的 COVID-19 发病率低于民主党领导的州。2020 年 6 月 3 日,这种关联发生了逆转,共和党领导的州的发病率更高(风险比=1.10,95%后验区间=1.01,1.18)。这一趋势一直持续到 2020 年 12 月初。死亡率方面,疫情早期共和党领导的州死亡率较低,但从 2020 年 7 月 4 日(风险比=1.18,95%后验区间=1.02,1.31)开始至 2020 年 12 月中旬,死亡率较高。从 2020 年 5 月 30 日开始,共和党领导的州的检测阳性率更高(风险比=1.70,95%后验区间=1.66,1.73),到 2020 年 9 月 30 日,检测率更低(风险比=0.95,95%后验区间=0.90,0.98)。
州长党派关系可能会推动影响美国 COVID-19 感染和死亡的政策决策。未来的政策决策应该以公共卫生考虑为指导,而不是以政治意识形态为指导。