Centre for Health Informatics, Computing, and Statistics, Lancaster Medical School, Lancaster University, Lancaster, United Kingdom.
Department of Control of Neglected Tropical Diseases, World Health Organization , Geneva, Switzerland.
Clin Infect Dis. 2021 Jun 14;72(Suppl 3):S172-S179. doi: 10.1093/cid/ciab192.
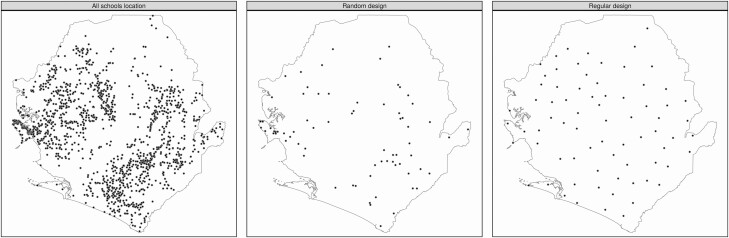
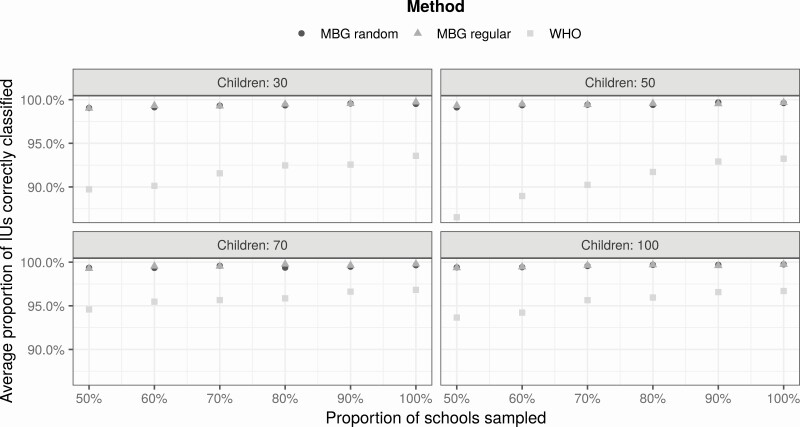
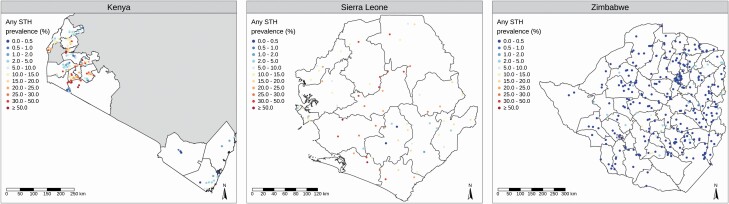
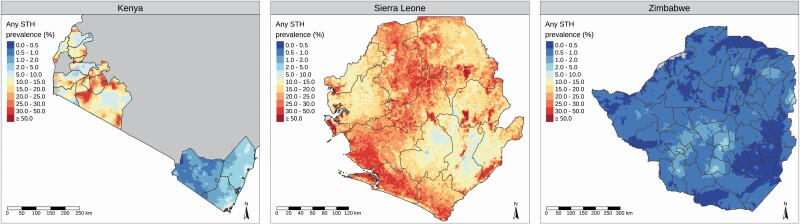
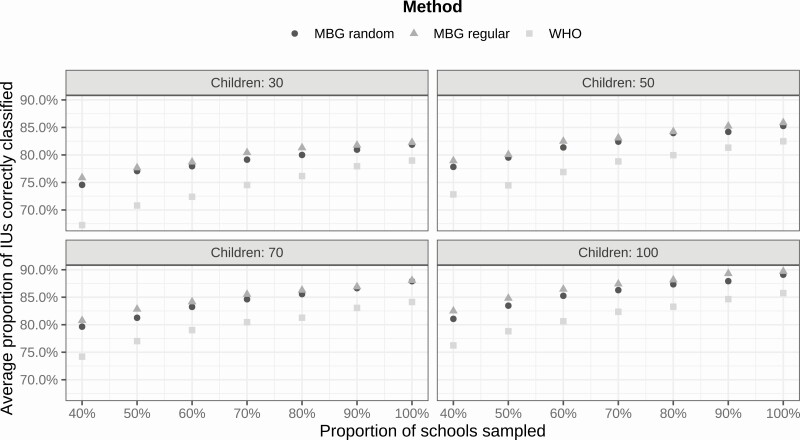
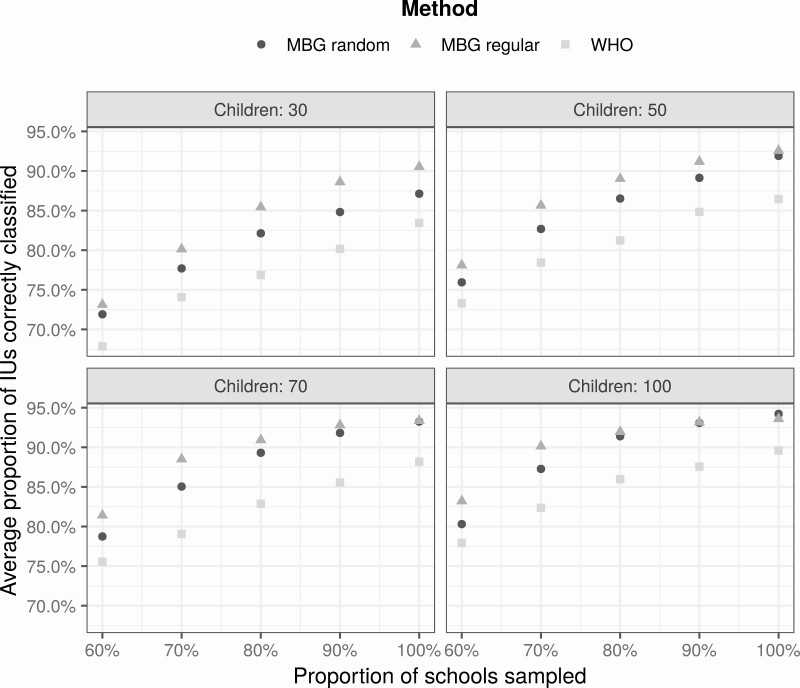
Maps of the geographical variation in prevalence play an important role in large-scale programs for the control of neglected tropical diseases. Precontrol mapping is needed to establish the appropriate control intervention in each area of the country in question. Mapping is also needed postintervention to measure the success of control efforts. In the absence of comprehensive disease registries, mapping efforts can be informed by 2 kinds of data: empirical estimates of local prevalence obtained by testing individuals from a sample of communities within the geographical region of interest, and digital images of environmental factors that are predictive of local prevalence. In this article, we focus on the design and analysis of impact surveys, that is, prevalence surveys that are conducted postintervention with the aim of informing decisions on what further intervention, if any, is needed to achieve elimination of the disease as a public health problem. We show that geospatial statistical methods enable prevalence surveys to be designed and analyzed as efficiently as possible so as to make best use of hard-won field data. We use 3 case studies based on data from soil-transmitted helminth impact surveys in Kenya, Sierra Leone, and Zimbabwe to compare the predictive performance of model-based geostatistics with methods described in current World Health Organization (WHO) guidelines. In all 3 cases, we find that model-based geostatistics substantially outperforms the current WHO guidelines, delivering improved precision for reduced field-sampling effort. We argue from experience that similar improvements will hold for prevalence mapping of other neglected tropical diseases.
地理分布差异患病率图在大规模控制被忽视的热带病计划中起着重要作用。需要进行预控制绘图,以确定该国每个地区的适当控制干预措施。干预后也需要进行绘图,以衡量控制工作的成功。在缺乏全面疾病登记册的情况下,绘图工作可以通过以下两种数据来提供信息:从感兴趣地理区域内的社区样本中测试个体获得的当地患病率的经验估计,以及预测当地患病率的环境因素的数字图像。在本文中,我们重点介绍影响调查的设计和分析,即干预后进行的患病率调查,旨在就是否需要进一步干预以消除疾病作为公共卫生问题做出决策提供信息。我们表明,地理空间统计方法可使患病率调查尽可能高效地进行设计和分析,从而充分利用来之不易的实地数据。我们使用基于肯尼亚、塞拉利昂和津巴布韦土壤传播性蠕虫影响调查数据的 3 个案例研究,比较了基于模型的地质统计学方法与当前世界卫生组织 (WHO) 指南中描述的方法的预测性能。在所有 3 个案例中,我们发现基于模型的地质统计学方法大大优于当前的 WHO 指南,在减少实地采样工作的同时提高了精度。根据经验,我们认为对于其他被忽视的热带病的患病率绘图也将有类似的改进。