• 文献检索
  • 文档翻译
  • 深度研究
  • 学术资讯
  • Suppr Zotero 插件Zotero 插件
  • 邀请有礼
  • 套餐&价格
  • 历史记录
应用&插件
Suppr Zotero 插件Zotero 插件浏览器插件Mac 客户端Windows 客户端微信小程序
定价
高级版会员购买积分包购买API积分包
服务
文献检索文档翻译深度研究API 文档MCP 服务
关于我们
关于 Suppr公司介绍联系我们用户协议隐私条款
关注我们

Suppr 超能文献

核心技术专利:CN118964589B侵权必究
粤ICP备2023148730 号-1Suppr @ 2026

文献检索

告别复杂PubMed语法,用中文像聊天一样搜索,搜遍4000万医学文献。AI智能推荐,让科研检索更轻松。

立即免费搜索

文件翻译

保留排版,准确专业,支持PDF/Word/PPT等文件格式,支持 12+语言互译。

免费翻译文档

深度研究

AI帮你快速写综述,25分钟生成高质量综述,智能提取关键信息,辅助科研写作。

立即免费体验

比较人群诊断和死亡模式估算特定年龄段 COVID-19 病死率和死亡时间:澳大利亚数据。

Estimating age-specific COVID-19 fatality risk and time to death by comparing population diagnosis and death patterns: Australian data.

机构信息

Trials Centre, National Health and Medical Research Council Clinical Trials Centre, The University of Sydney, Sydney, NSW, 2006, Australia.

出版信息

BMC Med Res Methodol. 2021 Jun 21;21(1):126. doi: 10.1186/s12874-021-01314-w.

DOI:10.1186/s12874-021-01314-w
PMID:34154563
原文链接:https://pmc.ncbi.nlm.nih.gov/articles/PMC8215490/
Abstract

BACKGROUND

Mortality is a key component of the natural history of COVID-19 infection. Surveillance data on COVID-19 deaths and case diagnoses are widely available in the public domain, but they are not used to model time to death because they typically do not link diagnosis and death at an individual level. This paper demonstrates that by comparing the unlinked patterns of new diagnoses and deaths over age and time, age-specific mortality and time to death may be estimated using a statistical method called deconvolution.

METHODS

Age-specific data were analysed on 816 deaths among 6235 cases over age 50 years in Victoria, Australia, from the period January through December 2020. Deconvolution was applied assuming logistic dependence of case fatality risk (CFR) on age and a gamma time to death distribution. Non-parametric deconvolution analyses stratified into separate age groups were used to assess the model assumptions.

RESULTS

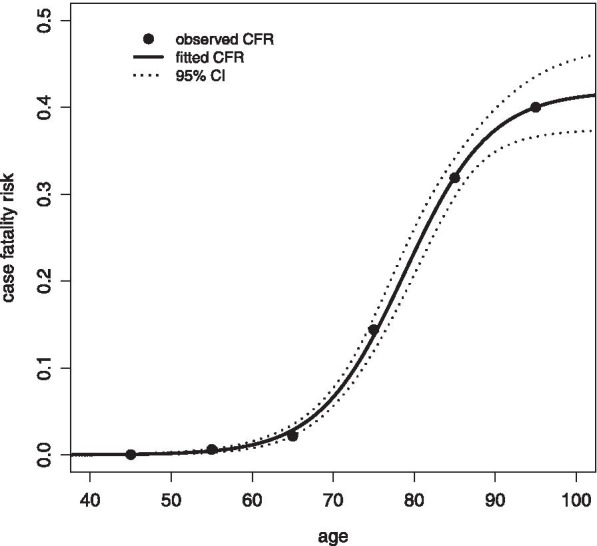
It was found that age-specific CFR rose from 2.9% at age 65 years (95% CI:2.2 - 3.5) to 40.0% at age 95 years (CI: 36.6 - 43.6). The estimated mean time between diagnosis and death was 18.1 days (CI: 16.9 - 19.3) and showed no evidence of varying by age (heterogeneity P = 0.97). The estimated 90% percentile of time to death was 33.3 days (CI: 30.4 - 36.3; heterogeneity P = 0.85). The final age-specific model provided a good fit to the observed age-stratified mortality patterns.

CONCLUSIONS

Deconvolution was demonstrated to be a powerful analysis method that could be applied to extensive data sources worldwide. Such analyses can inform transmission dynamics models and CFR assessment in emerging outbreaks. Based on these Australian data it is concluded that death from COVID-19 occurs within three weeks of diagnosis on average but takes five weeks in 10% of fatal cases. Fatality risk is negligible in the young but rises above 40% in the elderly, while time to death does not seem to vary by age.

摘要

背景

死亡率是 COVID-19 感染自然史的一个关键组成部分。COVID-19 死亡和病例诊断的监测数据在公共领域广泛可用,但它们未被用于构建死亡时间模型,因为它们通常不能在个体层面上将诊断和死亡联系起来。本文证明,通过比较年龄和时间上的新诊断和死亡的非链接模式,可以使用一种称为反卷积的统计方法来估计特定年龄的死亡率和死亡时间。

方法

对 2020 年 1 月至 12 月期间澳大利亚维多利亚州年龄在 50 岁以上的 6235 例病例中的 816 例死亡进行了特定年龄的数据分析。应用反卷积时,假设病例死亡率(CFR)的风险对数依赖性(logistic dependence)随年龄和伽马死亡时间分布。使用分层的非参数反卷积分析来评估模型假设。

结果

发现特定年龄的 CFR 从 65 岁时的 2.9%(95%CI:2.2-3.5)上升到 95 岁时的 40.0%(CI:36.6-43.6)。诊断与死亡之间的估计平均时间为 18.1 天(CI:16.9-19.3),并且没有证据表明年龄存在差异(异质性 P=0.97)。估计的死亡时间 90%分位数为 33.3 天(CI:30.4-36.3;异质性 P=0.85)。最终的特定年龄模型与观察到的分层死亡率模式拟合良好。

结论

证明反卷积是一种强大的分析方法,可应用于全球广泛的数据来源。此类分析可以为新兴暴发中的传播动力学模型和 CFR 评估提供信息。基于这些澳大利亚数据,可以得出结论,COVID-19 死亡平均在诊断后三周内发生,但在 10%的致死病例中需要五周时间。年轻人的病死率可以忽略不计,但在老年人中超过 40%,而死亡时间似乎不受年龄影响。

https://cdn.ncbi.nlm.nih.gov/pmc/blobs/496c/8215747/8d9d4e209d3a/12874_2021_1314_Fig5_HTML.jpg
https://cdn.ncbi.nlm.nih.gov/pmc/blobs/496c/8215747/f766477fbb15/12874_2021_1314_Fig1_HTML.jpg
https://cdn.ncbi.nlm.nih.gov/pmc/blobs/496c/8215747/d6c7644121b1/12874_2021_1314_Fig2_HTML.jpg
https://cdn.ncbi.nlm.nih.gov/pmc/blobs/496c/8215747/abf186014d1e/12874_2021_1314_Fig3_HTML.jpg
https://cdn.ncbi.nlm.nih.gov/pmc/blobs/496c/8215747/28cbcc676171/12874_2021_1314_Fig4_HTML.jpg
https://cdn.ncbi.nlm.nih.gov/pmc/blobs/496c/8215747/8d9d4e209d3a/12874_2021_1314_Fig5_HTML.jpg

相似文献

1
Estimating age-specific COVID-19 fatality risk and time to death by comparing population diagnosis and death patterns: Australian data.比较人群诊断和死亡模式估算特定年龄段 COVID-19 病死率和死亡时间:澳大利亚数据。
BMC Med Res Methodol. 2021 Jun 21;21(1):126. doi: 10.1186/s12874-021-01314-w.
2
Sex differences in the incidence, mortality, and fatality of COVID-19 in Peru.秘鲁新冠肺炎发病率、死亡率及病死率的性别差异。
PLoS One. 2021 Jun 14;16(6):e0253193. doi: 10.1371/journal.pone.0253193. eCollection 2021.
3
COVID-19, Australia: Epidemiology Report 17 (Fortnightly reporting period ending 24 May 2020).2019冠状病毒病,澳大利亚:流行病学报告第17期(截至2020年5月24日的两周报告期)
Commun Dis Intell (2018). 2020 Jun 5;44. doi: 10.33321/cdi.2020.44.51.
4
Estimating the instant case fatality rate of COVID-19 in China.估算中国 COVID-19 的即时病死率。
Int J Infect Dis. 2020 Aug;97:1-6. doi: 10.1016/j.ijid.2020.04.055. Epub 2020 Apr 24.
5
COVID-19, Australia: Epidemiology Report 16 (Reporting week to 23:59 AEST 17 May 2020).2019冠状病毒病,澳大利亚:流行病学报告16(截至澳大利亚东部标准时间2020年5月17日23:59的报告周)
Commun Dis Intell (2018). 2020 May 22;44. doi: 10.33321/cdi.2020.44.45.
6
COVID-19, Australia: Epidemiology Report 19 (Fortnightly reporting period ending 21 June 2020).2019冠状病毒病,澳大利亚:流行病学报告19(截至2020年6月21日的两周报告期)
Commun Dis Intell (2018). 2020 Jun 29;44. doi: 10.33321/cdi.2020.44.54.
7
Characterizing a two-pronged epidemic in Mexico of non-communicable diseases and SARS-Cov-2: factors associated with increased case-fatality rates.解析墨西哥非传染性疾病和新冠病毒的双重疫情:与病死率上升相关的因素
Int J Epidemiol. 2021 May 17;50(2):430-445. doi: 10.1093/ije/dyab008.
8
Demystifying the varying case fatality rates (CFR) of COVID-19 in India: Lessons learned and future directions.解读印度新冠病毒病(COVID-19)病死率各异的现象:经验教训与未来方向
J Infect Dev Ctries. 2020 Oct 31;14(10):1128-1135. doi: 10.3855/jidc.13340.
9
Delay-Adjusted Age-Specific COVID-19 Case Fatality Rates in a High Testing Setting: South Korea, February 2020 to February 2021.高检测环境下调整年龄别延迟的 COVID-19 病死率:韩国,2020 年 2 月至 2021 年 2 月。
Int J Environ Res Public Health. 2021 May 11;18(10):5053. doi: 10.3390/ijerph18105053.
10
Temporal dynamic in the impact of COVID- 19 outbreak on cause-specific mortality in Guangzhou, China.新冠疫情对中国广州特定病因死亡率影响的时间动态变化。
BMC Public Health. 2021 May 8;21(1):883. doi: 10.1186/s12889-021-10771-3.

引用本文的文献

1
Survival of hospitalised COVID-19 patients in Hawassa, Ethiopia: a cohort study.埃塞俄比亚霍拉萨尼医院 COVID-19 患者的生存情况:一项队列研究。
BMC Infect Dis. 2024 Sep 27;24(1):1055. doi: 10.1186/s12879-024-09905-w.
2
Impact of non-pharmaceutical interventions on COVID-19 incidence and deaths: cross-national natural experiment in 32 European countries.非药物干预对 COVID-19 发病率和死亡率的影响:32 个欧洲国家的跨国自然实验。
BMC Public Health. 2024 Aug 28;24(1):2341. doi: 10.1186/s12889-024-19799-7.
3
Bulk and Single-Cell RNA Sequencing Elucidate the Etiology of Severe COVID-19.

本文引用的文献

1
Practical considerations for measuring the effective reproductive number, Rt.测量有效繁殖数,Rt 的实用考虑因素。
PLoS Comput Biol. 2020 Dec 10;16(12):e1008409. doi: 10.1371/journal.pcbi.1008409. eCollection 2020 Dec.
2
Modelling the impact of relaxing COVID-19 control measures during a period of low viral transmission.在病毒低传播期间放松 COVID-19 控制措施的影响建模。
Med J Aust. 2021 Feb;214(2):79-83. doi: 10.5694/mja2.50845. Epub 2020 Nov 18.
3
Reconstructing the early global dynamics of under-ascertained COVID-19 cases and infections.
大样本和单细胞 RNA 测序解析严重 COVID-19 的病因。
Int J Mol Sci. 2024 Mar 14;25(6):3280. doi: 10.3390/ijms25063280.
4
Public interest trends for COVID-19 and pandemic trajectory: A time-series analysis of US state-level data.新冠疫情的公众关注趋势与大流行轨迹:基于美国州级数据的时间序列分析
PLOS Digit Health. 2024 Mar 12;3(3):e0000462. doi: 10.1371/journal.pdig.0000462. eCollection 2024 Mar.
5
COVID-19 and End of Life in a Quaternary Australian Hospital: Referral for Palliative Care Consultation.澳大利亚一家四级医院的新冠疫情与临终关怀:姑息治疗会诊转诊
Palliat Med Rep. 2024 Jan 5;5(1):3-9. doi: 10.1089/pmr.2023.0069. eCollection 2024.
6
COVID-19 in Pakistan: A national analysis of five pandemic waves.巴基斯坦的 COVID-19 疫情:五次大流行浪潮的国家分析。
PLoS One. 2023 Dec 29;18(12):e0281326. doi: 10.1371/journal.pone.0281326. eCollection 2023.
7
Association of prior treatment with nitrogen-containing bisphosphonates on outcomes of COVID-19 positive patients.COVID-19 阳性患者接受含氮双膦酸盐治疗与结局的相关性。
Osteoporos Int. 2024 Jan;35(1):181-187. doi: 10.1007/s00198-023-06912-6. Epub 2023 Sep 13.
8
Understanding the efficacy of wastewater surveillance for SARS-CoV-2 in two diverse communities.了解废水监测在两个不同社区中对 SARS-CoV-2 的效果。
PLoS One. 2023 Aug 3;18(8):e0289343. doi: 10.1371/journal.pone.0289343. eCollection 2023.
9
Repeated antibiotic exposure and risk of hospitalisation and death following COVID-19 infection (OpenSAFELY): a matched case-control study.重复使用抗生素与新冠病毒感染后的住院和死亡风险(OpenSAFELY):一项配对病例对照研究
EClinicalMedicine. 2023 Jul 5;61:102064. doi: 10.1016/j.eclinm.2023.102064. eCollection 2023 Jul.
10
Waves of inequality: income differences in intensive care due to Covid-19 in Sweden.不平等的浪潮:瑞典因新冠病毒而在重症监护中产生的收入差距。
Eur J Public Health. 2023 Aug 1;33(4):574-579. doi: 10.1093/eurpub/ckad094.
重建未被确认的 COVID-19 病例和感染的早期全球动态。
BMC Med. 2020 Oct 22;18(1):332. doi: 10.1186/s12916-020-01790-9.
4
Coronavirus Disease Model to Inform Transmission-Reducing Measures and Health System Preparedness, Australia.澳大利亚基于冠状病毒疾病模型的信息,制定了降低传播风险的措施和卫生系统准备计划。
Emerg Infect Dis. 2020 Dec;26(12):2844-2853. doi: 10.3201/eid2612.202530. Epub 2020 Sep 28.
5
The probability of the 6-week lockdown in Victoria (commencing 9 July 2020) achieving elimination of community transmission of SARS-CoV-2.维多利亚州为期6周的封锁措施(于2020年7月9日开始)实现消除SARS-CoV-2社区传播的概率。
Med J Aust. 2020 Oct;213(8):349-351.e1. doi: 10.5694/mja2.50786. Epub 2020 Sep 27.
6
Early analysis of the Australian COVID-19 epidemic.澳大利亚 COVID-19 疫情的早期分析。
Elife. 2020 Aug 13;9:e58785. doi: 10.7554/eLife.58785.
7
Estimating the Risk of COVID-19 Death During the Course of the Outbreak in Korea, February-May 2020.估算2020年2月至5月韩国疫情期间新冠病毒疾病死亡风险
J Clin Med. 2020 May 29;9(6):1641. doi: 10.3390/jcm9061641.
8
Back-projection of COVID-19 diagnosis counts to assess infection incidence and control measures: analysis of Australian data.回溯法预测 COVID-19 诊断病例以评估感染发生率和控制措施:澳大利亚数据分析。
Epidemiol Infect. 2020 May 18;148:e97. doi: 10.1017/S0950268820001065.
9
Case Fatality Risk of the First Pandemic Wave of Coronavirus Disease 2019 (COVID-19) in China.中国2019年冠状病毒病(COVID-19)第一波大流行的病死率
Clin Infect Dis. 2021 Jul 1;73(1):e79-e85. doi: 10.1093/cid/ciaa578.
10
Estimating clinical severity of COVID-19 from the transmission dynamics in Wuhan, China.从中国武汉的传播动态估计 COVID-19 的临床严重程度。
Nat Med. 2020 Apr;26(4):506-510. doi: 10.1038/s41591-020-0822-7. Epub 2020 Mar 19.