• 文献检索
  • 文档翻译
  • 深度研究
  • 学术资讯
  • Suppr Zotero 插件Zotero 插件
  • 邀请有礼
  • 套餐&价格
  • 历史记录
应用&插件
Suppr Zotero 插件Zotero 插件浏览器插件Mac 客户端Windows 客户端微信小程序
定价
高级版会员购买积分包购买API积分包
服务
文献检索文档翻译深度研究API 文档MCP 服务
关于我们
关于 Suppr公司介绍联系我们用户协议隐私条款
关注我们

Suppr 超能文献

核心技术专利:CN118964589B侵权必究
粤ICP备2023148730 号-1Suppr @ 2026

文献检索

告别复杂PubMed语法,用中文像聊天一样搜索,搜遍4000万医学文献。AI智能推荐,让科研检索更轻松。

立即免费搜索

文件翻译

保留排版,准确专业,支持PDF/Word/PPT等文件格式,支持 12+语言互译。

免费翻译文档

深度研究

AI帮你快速写综述,25分钟生成高质量综述,智能提取关键信息,辅助科研写作。

立即免费体验

新型冠状病毒(COVID-19)传播的SEIAQRDT模型:以印度为例的研究

SEIAQRDT model for the spread of novel coronavirus (COVID-19): A case study in India.

作者信息

Kumari Preety, Singh Harendra Pal, Singh Swarn

机构信息

Faculty of Mathematical Science, University of Delhi, Delhi, 110007 India.

School of Engineering & Technology, Central University of Haryana, Mahendergarh, 123031 India.

出版信息

Appl Intell (Dordr). 2021;51(5):2818-2837. doi: 10.1007/s10489-020-01929-4. Epub 2020 Nov 13.

DOI:10.1007/s10489-020-01929-4
PMID:34764566
原文链接:https://pmc.ncbi.nlm.nih.gov/articles/PMC7662031/
Abstract

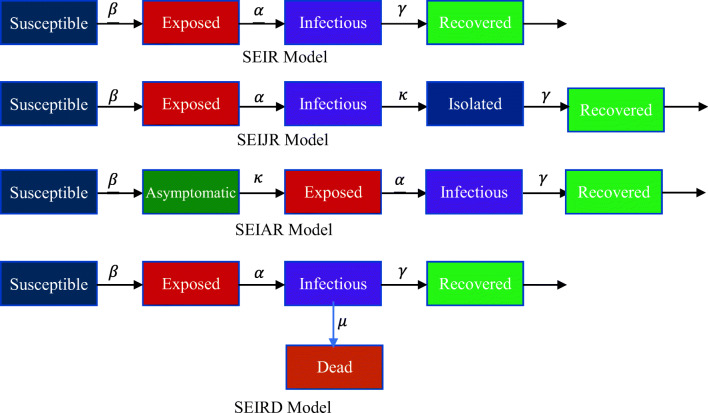
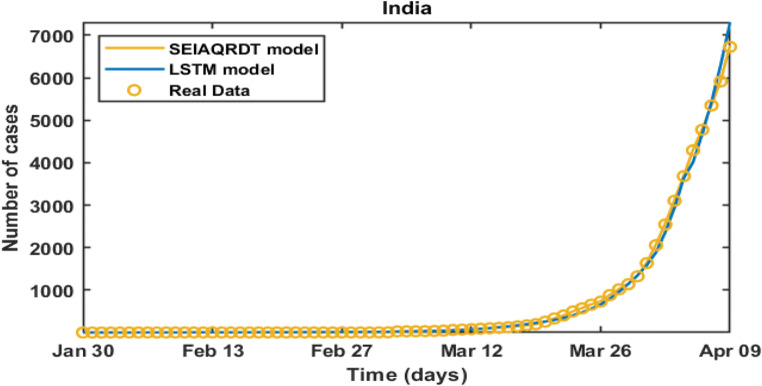
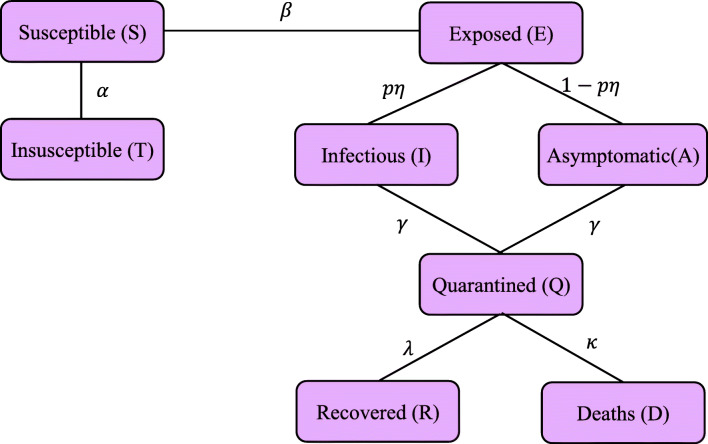
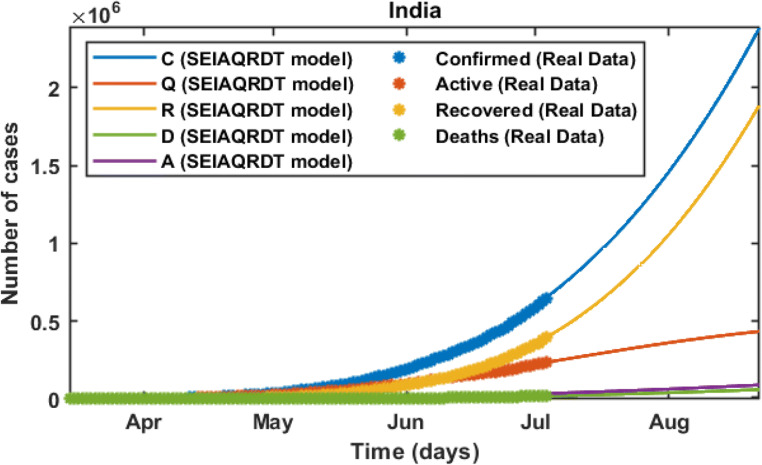
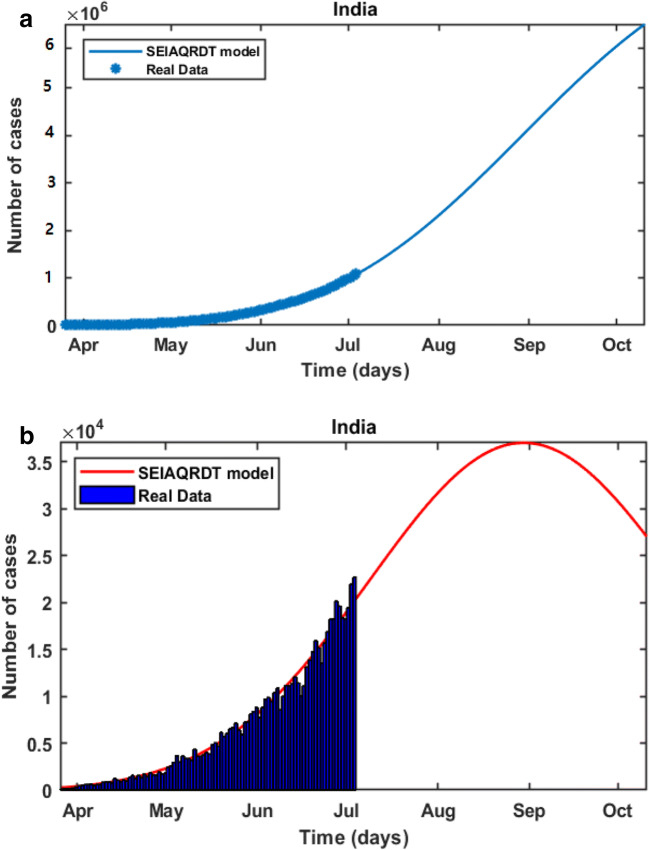
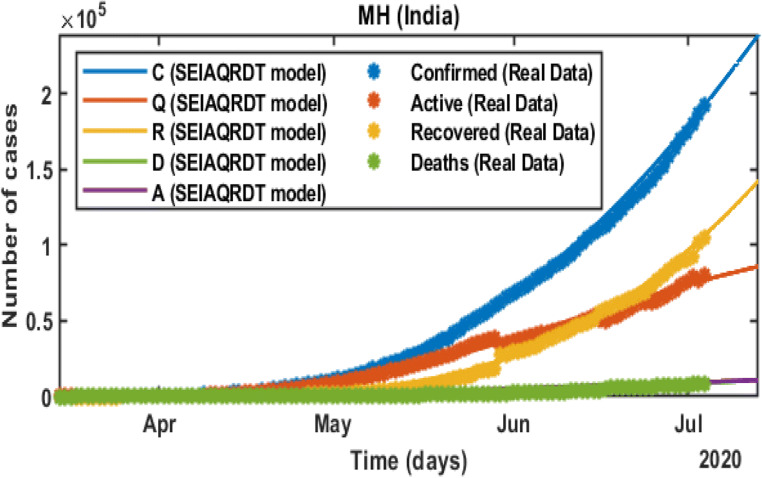
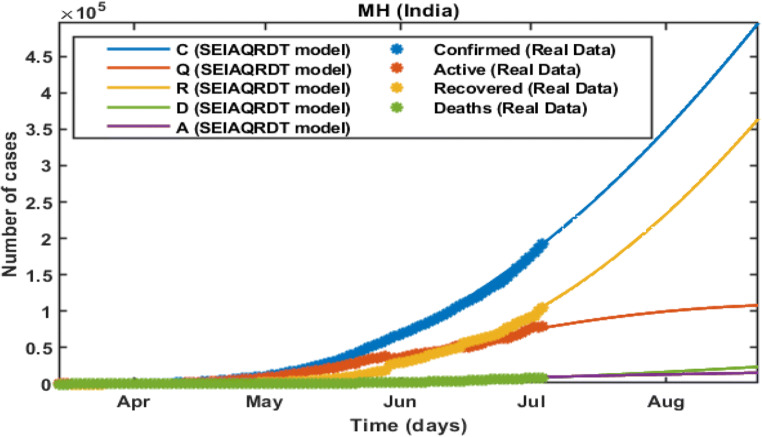
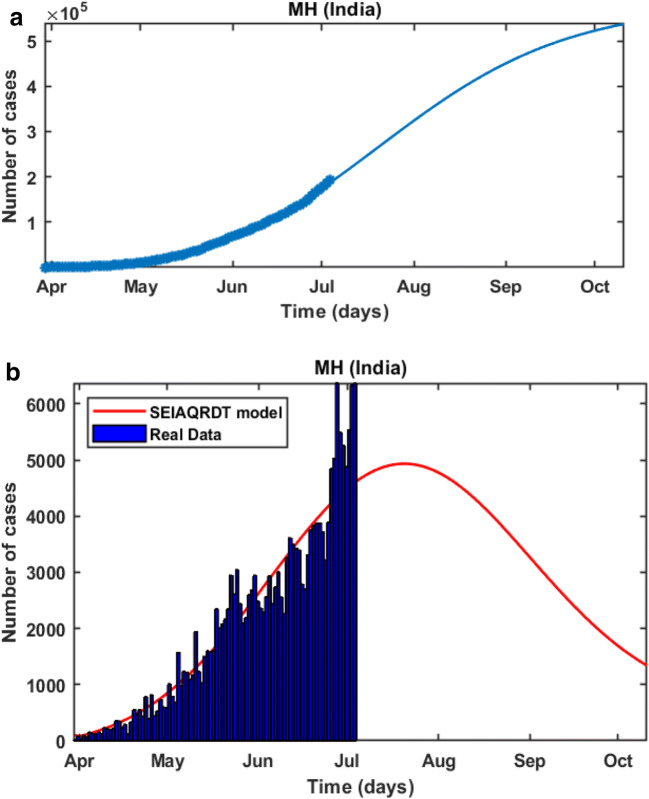
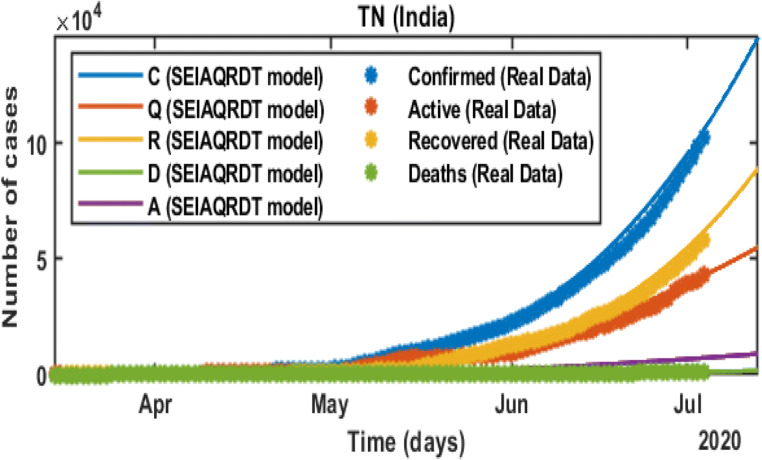
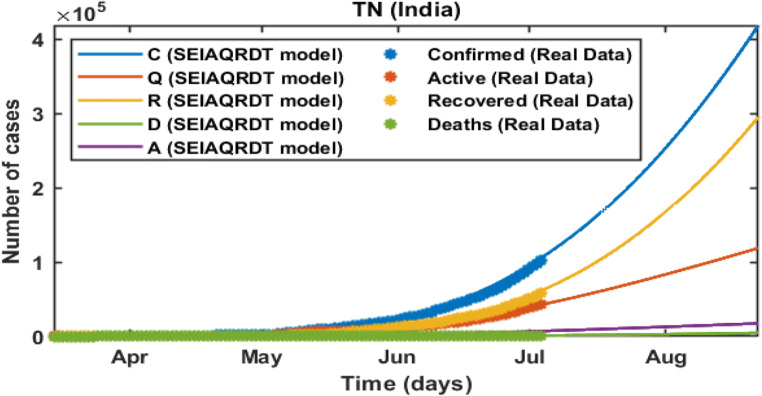
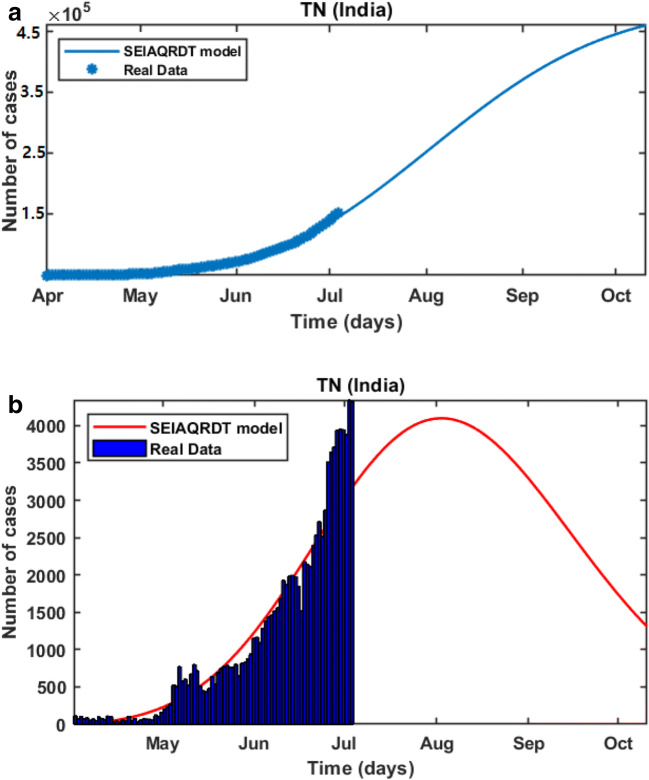
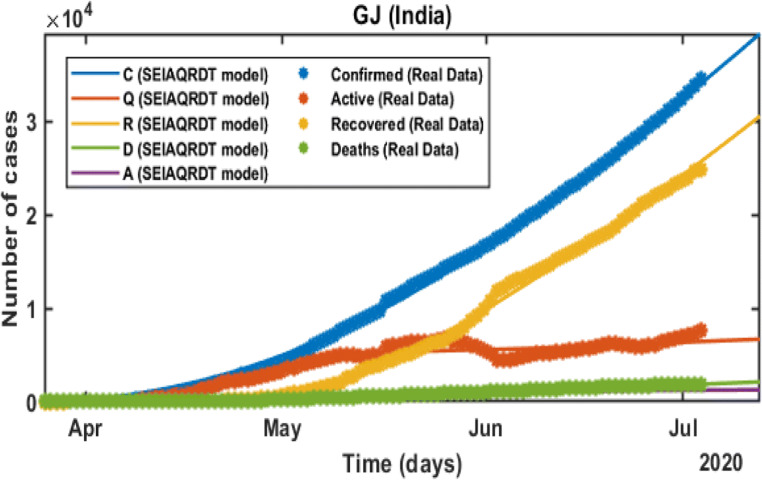
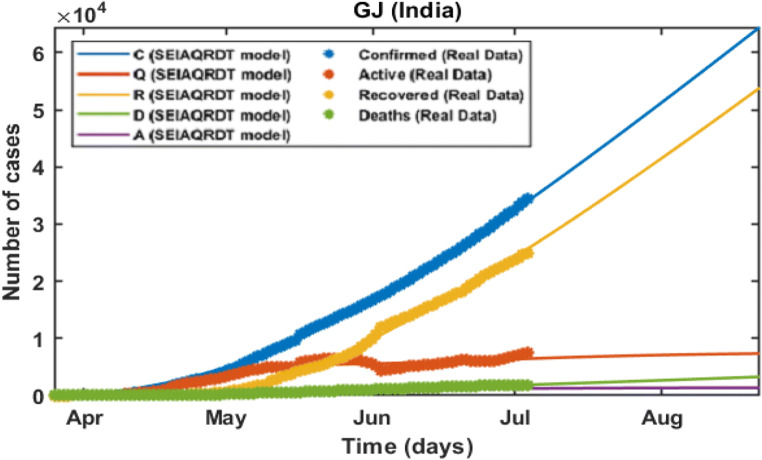
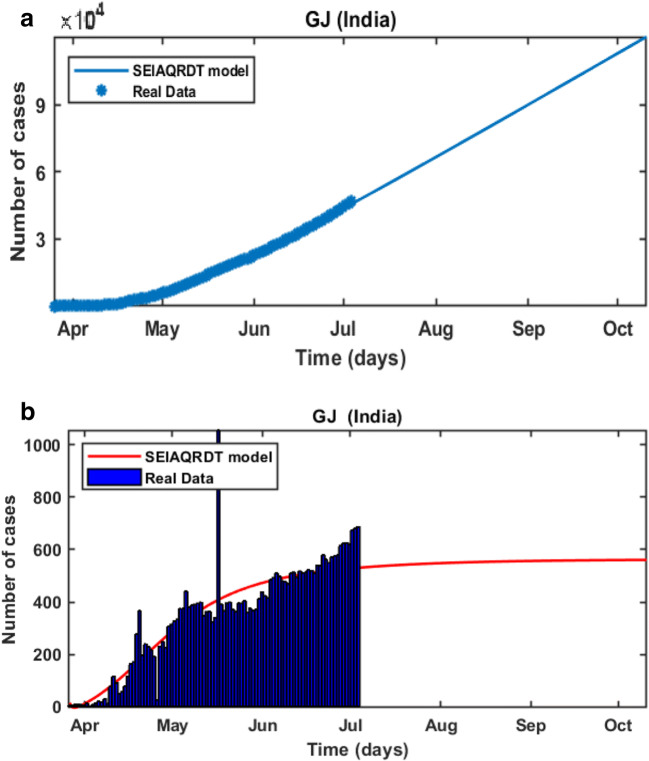
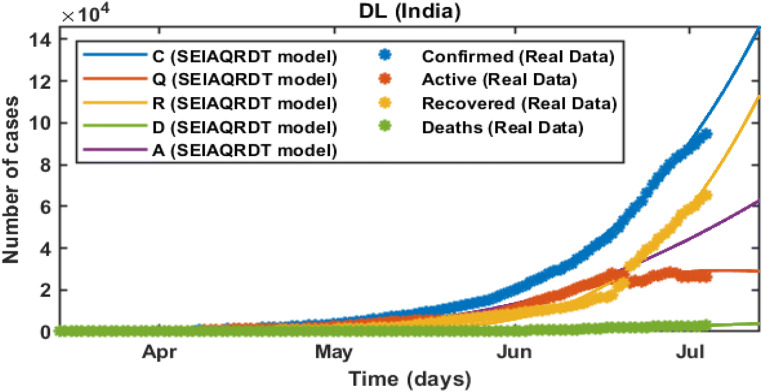
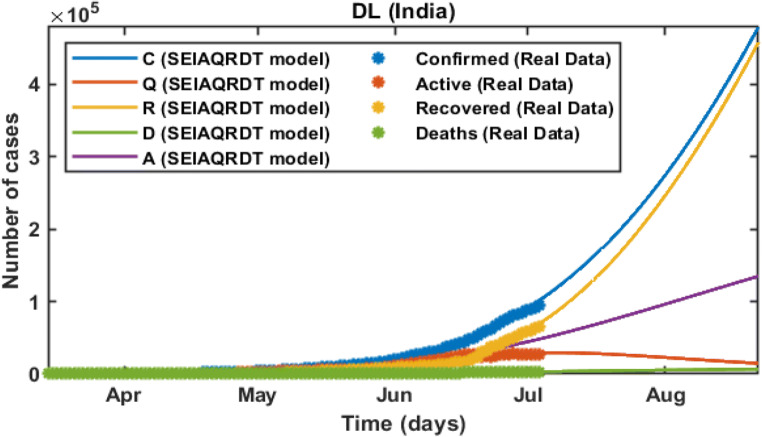
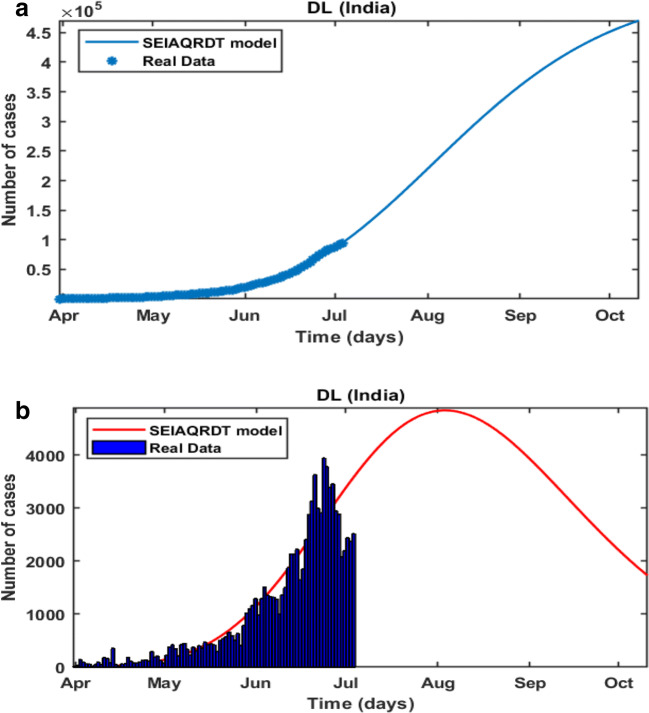
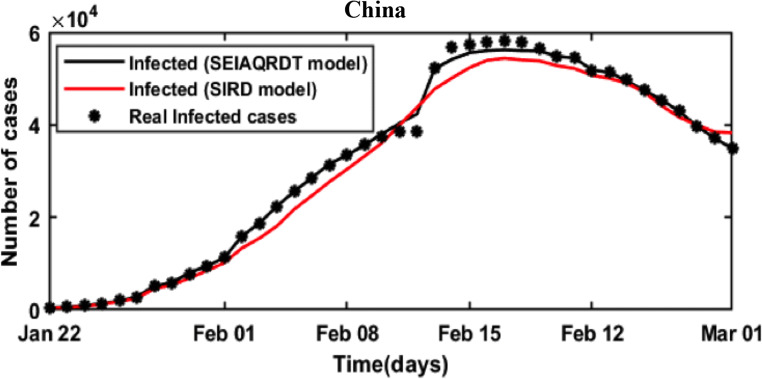
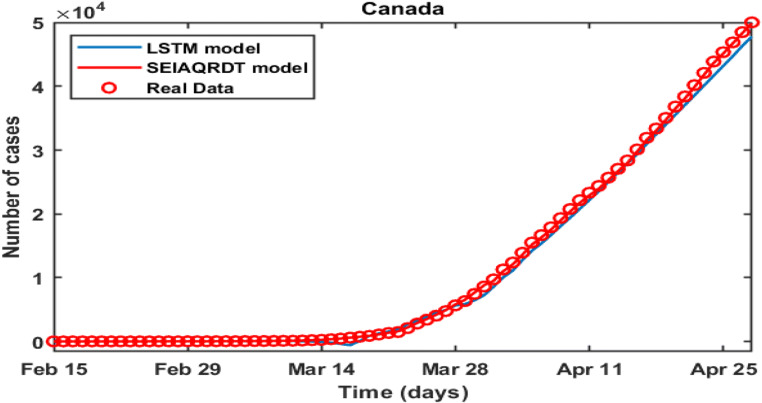
COVID-19 is a global pandemic declared by WHO. This pandemic requires the execution of planned control strategies, incorporating quarantine, self-isolation, and tracing of asymptomatic cases. Mathematical modeling is one of the prominent techniques for predicting and controlling the spread of COVID-19. The predictions of earlier proposed epidemiological models (e.g. SIR, SEIR, SIRD, SEIRD, etc.) are not much accurate due to lack of consideration for transmission of the epidemic during the latent period. Moreover, it is important to classify infected individuals to control this pandemic. Therefore, a new mathematical model is proposed to incorporate infected individuals based on whether they have symptoms or not. This model forecasts the number of cases more accurately, which may help in better planning of control strategies. The model consists of eight compartments: susceptible (S), exposed (E), infected (I), asymptomatic (A), quarantined (Q), recovered (R), deaths (D), and insusceptible (T), accumulatively named as SEIAQRDT. This model is employed to predict the pandemic results for India and its majorly affected states. The estimated number of cases using the SEIAQRDT model is compared with SIRD, SEIR, and LSTM models. The relative error square analysis is used to verify the accuracy of the proposed model. The simulation is done on real datasets and results show the effectiveness of the proposed approach. These results may help the government and individuals to make the planning in this pandemic situation.

摘要

COVID-19是世界卫生组织宣布的全球大流行病。这场大流行病需要实施有计划的控制策略,包括检疫、自我隔离以及追踪无症状病例。数学建模是预测和控制COVID-19传播的突出技术之一。由于早期提出的流行病学模型(如SIR、SEIR、SIRD、SEIRD等)没有考虑潜伏期内疫情的传播,其预测不太准确。此外,对感染个体进行分类对于控制这场大流行病很重要。因此,提出了一种新的数学模型,根据感染个体是否有症状来纳入其中。该模型能更准确地预测病例数量,这可能有助于更好地规划控制策略。该模型由八个部分组成:易感者(S)、暴露者(E)、感染者(I)、无症状者(A)、被隔离者(Q)、康复者(R)、死亡者(D)和免疫者(T),统称为SEIAQRDT。该模型用于预测印度及其主要受影响邦的大流行结果。将使用SEIAQRDT模型估计的病例数与SIRD、SEIR和LSTM模型进行比较。采用相对误差平方分析来验证所提模型的准确性。在真实数据集上进行了模拟,结果表明了所提方法的有效性。这些结果可能有助于政府和个人在这种大流行情况下进行规划。

https://cdn.ncbi.nlm.nih.gov/pmc/blobs/1e80/7662031/5f2a2f71856a/10489_2020_1929_Fig21_HTML.jpg
https://cdn.ncbi.nlm.nih.gov/pmc/blobs/1e80/7662031/3ab4ca5b4d22/10489_2020_1929_Fig1_HTML.jpg
https://cdn.ncbi.nlm.nih.gov/pmc/blobs/1e80/7662031/dfc4051ccec4/10489_2020_1929_Fig2_HTML.jpg
https://cdn.ncbi.nlm.nih.gov/pmc/blobs/1e80/7662031/a450594a9d00/10489_2020_1929_Fig4_HTML.jpg
https://cdn.ncbi.nlm.nih.gov/pmc/blobs/1e80/7662031/c6b511fa193e/10489_2020_1929_Fig5_HTML.jpg
https://cdn.ncbi.nlm.nih.gov/pmc/blobs/1e80/7662031/68cdf9866f81/10489_2020_1929_Fig6_HTML.jpg
https://cdn.ncbi.nlm.nih.gov/pmc/blobs/1e80/7662031/4c2df30be0e3/10489_2020_1929_Fig7_HTML.jpg
https://cdn.ncbi.nlm.nih.gov/pmc/blobs/1e80/7662031/95c3bcba8572/10489_2020_1929_Fig8_HTML.jpg
https://cdn.ncbi.nlm.nih.gov/pmc/blobs/1e80/7662031/5f2efe784ba6/10489_2020_1929_Fig9_HTML.jpg
https://cdn.ncbi.nlm.nih.gov/pmc/blobs/1e80/7662031/49bb901653c8/10489_2020_1929_Fig10_HTML.jpg
https://cdn.ncbi.nlm.nih.gov/pmc/blobs/1e80/7662031/0986e600301c/10489_2020_1929_Fig11_HTML.jpg
https://cdn.ncbi.nlm.nih.gov/pmc/blobs/1e80/7662031/c67255bfe30c/10489_2020_1929_Fig12_HTML.jpg
https://cdn.ncbi.nlm.nih.gov/pmc/blobs/1e80/7662031/bd53f3db804e/10489_2020_1929_Fig13_HTML.jpg
https://cdn.ncbi.nlm.nih.gov/pmc/blobs/1e80/7662031/06a5026117a2/10489_2020_1929_Fig14_HTML.jpg
https://cdn.ncbi.nlm.nih.gov/pmc/blobs/1e80/7662031/47f5799dd0c1/10489_2020_1929_Fig15_HTML.jpg
https://cdn.ncbi.nlm.nih.gov/pmc/blobs/1e80/7662031/c6edad965173/10489_2020_1929_Fig16_HTML.jpg
https://cdn.ncbi.nlm.nih.gov/pmc/blobs/1e80/7662031/38276f25f978/10489_2020_1929_Fig17_HTML.jpg
https://cdn.ncbi.nlm.nih.gov/pmc/blobs/1e80/7662031/d6350f468476/10489_2020_1929_Fig18_HTML.jpg
https://cdn.ncbi.nlm.nih.gov/pmc/blobs/1e80/7662031/e1362254f5ee/10489_2020_1929_Fig19_HTML.jpg
https://cdn.ncbi.nlm.nih.gov/pmc/blobs/1e80/7662031/5f2a2f71856a/10489_2020_1929_Fig21_HTML.jpg

相似文献

1
SEIAQRDT model for the spread of novel coronavirus (COVID-19): A case study in India.新型冠状病毒(COVID-19)传播的SEIAQRDT模型:以印度为例的研究
Appl Intell (Dordr). 2021;51(5):2818-2837. doi: 10.1007/s10489-020-01929-4. Epub 2020 Nov 13.
2
Prediction of COVID-19 Trend in India and Its Four Worst-Affected States Using Modified SEIRD and LSTM Models.使用改进的SEIRD和LSTM模型预测印度及其四个受影响最严重邦的COVID-19趋势。
SN Comput Sci. 2021;2(3):224. doi: 10.1007/s42979-021-00598-5. Epub 2021 Apr 20.
3
Modified SIRD Model for COVID-19 Spread Prediction for Northern and Southern States of India.用于印度北部和南部邦新冠病毒传播预测的改进SIRD模型
Chaos Solitons Fractals. 2021 Jul;148:111039. doi: 10.1016/j.chaos.2021.111039. Epub 2021 May 14.
4
Dynamical Analysis of COVID-19 Model Incorporating Environmental Factors.纳入环境因素的新冠肺炎模型动力学分析
Iran J Sci Technol Trans A Sci. 2022;46(6):1651-1666. doi: 10.1007/s40995-022-01372-9. Epub 2022 Nov 28.
5
Modeling and forecasting the COVID-19 pandemic in India.印度新冠疫情的建模与预测
Chaos Solitons Fractals. 2020 Oct;139:110049. doi: 10.1016/j.chaos.2020.110049. Epub 2020 Jun 28.
6
Predictive model with analysis of the initial spread of COVID-19 in India.预测模型分析印度 COVID-19 的初始传播情况。
Int J Med Inform. 2020 Nov;143:104262. doi: 10.1016/j.ijmedinf.2020.104262. Epub 2020 Aug 25.
7
A new SEAIRD pandemic prediction model with clinical and epidemiological data analysis on COVID-19 outbreak.一种基于新冠肺炎疫情临床和流行病学数据分析的新型SEAIRD大流行预测模型。
Appl Intell (Dordr). 2021;51(7):4162-4198. doi: 10.1007/s10489-020-01938-3. Epub 2021 Jan 1.
8
Modeling and tracking Covid-19 cases using Big Data analytics on HPCC system platformm.在惠普高性能计算集群(HPCC)系统平台上使用大数据分析对新冠病毒疾病(Covid-19)病例进行建模和追踪。
J Big Data. 2021;8(1):33. doi: 10.1186/s40537-021-00423-z. Epub 2021 Feb 15.
9
Modified SIR model for COVID-19 transmission dynamics: Simulation with case study of UK, US and India.用于新冠病毒传播动力学的改进SIR模型:以英国、美国和印度为例的模拟研究
Results Phys. 2022 Sep;40:105855. doi: 10.1016/j.rinp.2022.105855. Epub 2022 Jul 27.
10
The effectiveness of quarantine of Wuhan city against the Corona Virus Disease 2019 (COVID-19): A well-mixed SEIR model analysis.武汉市对 2019 年冠状病毒病(COVID-19)的隔离措施的有效性:一个混合 SEIR 模型分析。
J Med Virol. 2020 Jul;92(7):841-848. doi: 10.1002/jmv.25827. Epub 2020 Apr 25.

引用本文的文献

1
Dynamical Analysis of COVID-19 Model Incorporating Environmental Factors.纳入环境因素的新冠肺炎模型动力学分析
Iran J Sci Technol Trans A Sci. 2022;46(6):1651-1666. doi: 10.1007/s40995-022-01372-9. Epub 2022 Nov 28.
2
Using simulation modelling and systems science to help contain COVID-19: A systematic review.利用模拟建模和系统科学助力控制2019冠状病毒病:一项系统综述
Syst Res Behav Sci. 2022 Aug 19. doi: 10.1002/sres.2897.
3
Modeling and Analysis of COVID-19 Spread: The Impacts of Nonpharmaceutical Protocols.COVID-19 传播建模与分析:非药物干预措施的影响。

本文引用的文献

1
Novel coronavirus 2019-nCoV (COVID-19): early estimation of epidemiological parameters and epidemic size estimates.新型冠状病毒 2019-nCoV (COVID-19):流行病学参数和疫情规模的早期估计。
Philos Trans R Soc Lond B Biol Sci. 2021 Jul 19;376(1829):20200265. doi: 10.1098/rstb.2020.0265. Epub 2021 May 31.
2
A modified model to predict the COVID-19 outbreak in Spain and Italy: Simulating control scenarios and multi-scale epidemics.一种用于预测西班牙和意大利新冠疫情爆发的改进模型:模拟控制情景和多尺度疫情。
Results Phys. 2021 Feb;21:103746. doi: 10.1016/j.rinp.2020.103746. Epub 2020 Dec 25.
3
Prediction and analysis of COVID-19 positive cases using deep learning models: A descriptive case study of India.
Comput Math Methods Med. 2022 Sep 2;2022:7706447. doi: 10.1155/2022/7706447. eCollection 2022.
4
How many asymptomatic cases were unconfirmed in the US COVID-19 pandemic? The evidence from a serological survey.在美国新冠疫情期间有多少无症状病例未得到确诊?一项血清学调查的证据。
Chaos Solitons Fractals. 2022 Nov;164:112630. doi: 10.1016/j.chaos.2022.112630. Epub 2022 Sep 6.
5
Explainable features responsible for the high or low spread of SARS-CoV-2: Africa in view.导致新冠病毒传播率高或低的可解释特征:以非洲为例
Sci Afr. 2022 Sep;17:e01301. doi: 10.1016/j.sciaf.2022.e01301. Epub 2022 Jul 28.
6
Analysis of multi-strain infection of vaccinated and recovered population through epidemic model: Application to COVID-19.通过传染病模型分析接种疫苗和康复人群的多菌株感染:在 COVID-19 中的应用。
PLoS One. 2022 Jul 29;17(7):e0271446. doi: 10.1371/journal.pone.0271446. eCollection 2022.
7
Air pollution in five Indian megacities during the Christmas and New Year celebration amidst COVID-19 pandemic.在新冠疫情期间,印度五个特大城市在圣诞节和新年庆祝活动期间的空气污染情况。
Stoch Environ Res Risk Assess. 2022;36(11):3653-3683. doi: 10.1007/s00477-022-02214-1. Epub 2022 Apr 2.
8
Stochastic modeling, analysis, and simulation of the COVID-19 pandemic with explicit behavioral changes in Bogotá: A case study.波哥大新冠肺炎疫情的随机建模、分析与模拟:行为变化明确的案例研究
Infect Dis Model. 2022 Mar;7(1):199-211. doi: 10.1016/j.idm.2021.12.008. Epub 2021 Dec 31.
9
An Italian Survey on Dietary Habits and Changes during the COVID-19 Lockdown.一项关于意大利人在 COVID-19 封锁期间饮食习惯及变化的调查。
Nutrients. 2021 Apr 5;13(4):1197. doi: 10.3390/nu13041197.
10
Network dynamic model of epidemic transmission introducing a heterogeneous control factor.引入异质控制因素的传染病传播网络动态模型。
J Med Virol. 2021 Dec;93(12):6496-6505. doi: 10.1002/jmv.27025. Epub 2021 May 28.
使用深度学习模型对新冠病毒阳性病例进行预测与分析:印度的描述性案例研究
Chaos Solitons Fractals. 2020 Oct;139:110017. doi: 10.1016/j.chaos.2020.110017. Epub 2020 Jun 17.
4
Time series prediction of COVID-19 by mutation rate analysis using recurrent neural network-based LSTM model.基于递归神经网络的长短期记忆模型通过突变率分析对COVID-19进行时间序列预测。
Chaos Solitons Fractals. 2020 Sep;138:110018. doi: 10.1016/j.chaos.2020.110018. Epub 2020 Jun 13.
5
Comparative analysis and forecasting of COVID-19 cases in various European countries with ARIMA, NARNN and LSTM approaches.采用自回归积分滑动平均模型(ARIMA)、非线性自回归神经网络(NARNN)和长短期记忆网络(LSTM)方法对欧洲各国新冠肺炎病例进行比较分析与预测。
Chaos Solitons Fractals. 2020 Sep;138:110015. doi: 10.1016/j.chaos.2020.110015. Epub 2020 Jun 13.
6
Time series forecasting of COVID-19 transmission in Canada using LSTM networks.使用长短期记忆网络对加拿大新冠病毒传播进行时间序列预测。
Chaos Solitons Fractals. 2020 Jun;135:109864. doi: 10.1016/j.chaos.2020.109864. Epub 2020 May 8.
7
Prediction for the spread of COVID-19 in India and effectiveness of preventive measures.预测 COVID-19 在印度的传播情况和预防措施的效果。
Sci Total Environ. 2020 Aug 1;728:138762. doi: 10.1016/j.scitotenv.2020.138762. Epub 2020 Apr 20.
8
Modelling the COVID-19 epidemic and implementation of population-wide interventions in Italy.对意大利 COVID-19 疫情的建模与全民干预措施的实施。
Nat Med. 2020 Jun;26(6):855-860. doi: 10.1038/s41591-020-0883-7. Epub 2020 Apr 22.
9
Analysis and forecast of COVID-19 spreading in China, Italy and France.新冠病毒在中国、意大利和法国传播情况的分析与预测。
Chaos Solitons Fractals. 2020 May;134:109761. doi: 10.1016/j.chaos.2020.109761. Epub 2020 Mar 21.
10
Prediction of COVID-19 Outbreak in China and Optimal Return Date for University Students Based on Propagation Dynamics.基于传播动力学的中国新冠肺炎疫情预测及大学生最佳返校日期
J Shanghai Jiaotong Univ Sci. 2020;25(2):140-146. doi: 10.1007/s12204-020-2167-2. Epub 2020 Apr 7.