• 文献检索
  • 文档翻译
  • 深度研究
  • 学术资讯
  • Suppr Zotero 插件Zotero 插件
  • 邀请有礼
  • 套餐&价格
  • 历史记录
应用&插件
Suppr Zotero 插件Zotero 插件浏览器插件Mac 客户端Windows 客户端微信小程序
定价
高级版会员购买积分包购买API积分包
服务
文献检索文档翻译深度研究API 文档MCP 服务
关于我们
关于 Suppr公司介绍联系我们用户协议隐私条款
关注我们

Suppr 超能文献

核心技术专利:CN118964589B侵权必究
粤ICP备2023148730 号-1Suppr @ 2026

文献检索

告别复杂PubMed语法,用中文像聊天一样搜索,搜遍4000万医学文献。AI智能推荐,让科研检索更轻松。

立即免费搜索

文件翻译

保留排版,准确专业,支持PDF/Word/PPT等文件格式,支持 12+语言互译。

免费翻译文档

深度研究

AI帮你快速写综述,25分钟生成高质量综述,智能提取关键信息,辅助科研写作。

立即免费体验

利用贝叶斯分层模型从监测数据估算美国的 COVID-19 住院人数:建模研究。

Estimating COVID-19 Hospitalizations in the United States With Surveillance Data Using a Bayesian Hierarchical Model: Modeling Study.

机构信息

Centers for Disease Control and Prevention, Atlanta, GA, United States.

United States Public Health Service, Rockville, MD, United States.

出版信息

JMIR Public Health Surveill. 2022 Jun 2;8(6):e34296. doi: 10.2196/34296.

DOI:10.2196/34296
PMID:35452402
原文链接:https://pmc.ncbi.nlm.nih.gov/articles/PMC9169704/
Abstract

BACKGROUND

In the United States, COVID-19 is a nationally notifiable disease, meaning cases and hospitalizations are reported by states to the Centers for Disease Control and Prevention (CDC). Identifying and reporting every case from every facility in the United States may not be feasible in the long term. Creating sustainable methods for estimating the burden of COVID-19 from established sentinel surveillance systems is becoming more important.

OBJECTIVE

We aimed to provide a method leveraging surveillance data to create a long-term solution to estimate monthly rates of hospitalizations for COVID-19.

METHODS

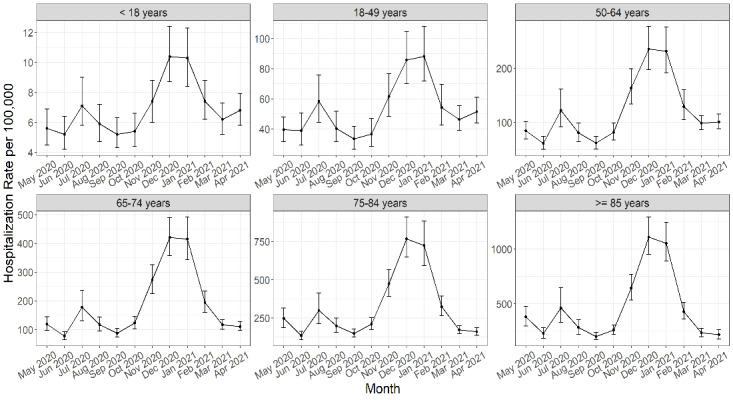
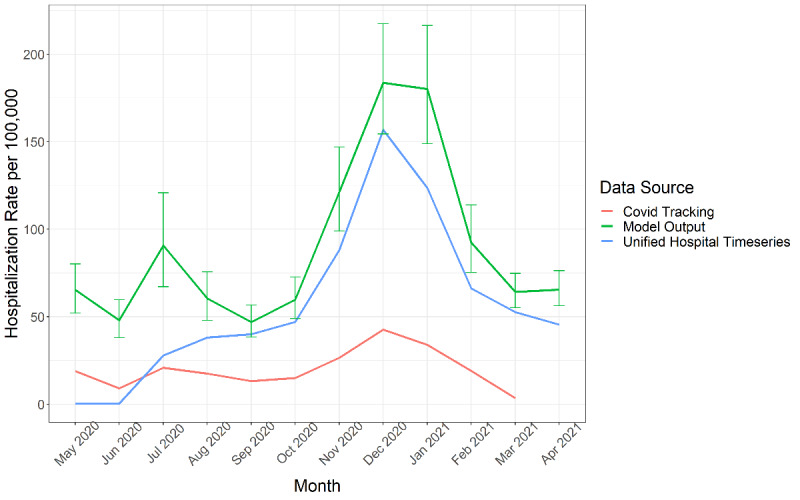
We estimated monthly hospitalization rates for COVID-19 from May 2020 through April 2021 for the 50 states using surveillance data from the COVID-19-Associated Hospitalization Surveillance Network (COVID-NET) and a Bayesian hierarchical model for extrapolation. Hospitalization rates were calculated from patients hospitalized with a lab-confirmed SARS-CoV-2 test during or within 14 days before admission. We created a model for 6 age groups (0-17, 18-49, 50-64, 65-74, 75-84, and ≥85 years) separately. We identified covariates from multiple data sources that varied by age, state, and month and performed covariate selection for each age group based on 2 methods, Least Absolute Shrinkage and Selection Operator (LASSO) and spike and slab selection methods. We validated our method by checking the sensitivity of model estimates to covariate selection and model extrapolation as well as comparing our results to external data.

RESULTS

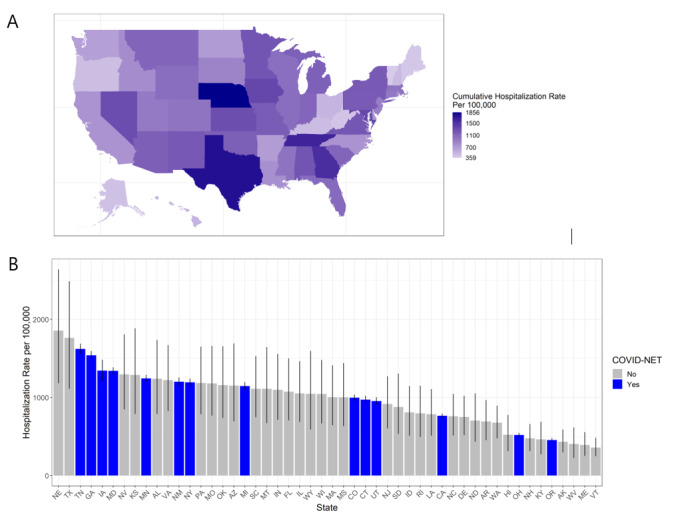
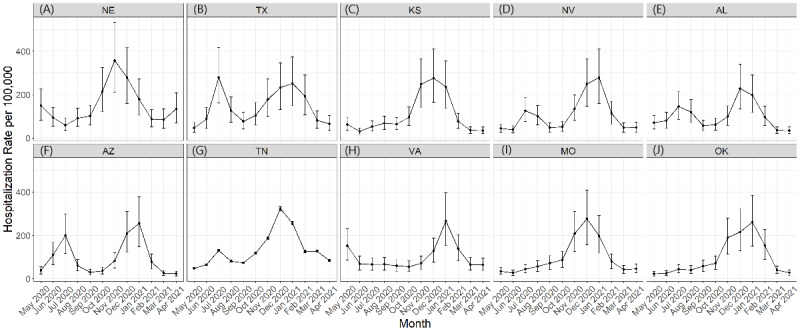
We estimated 3,583,100 (90% credible interval [CrI] 3,250,500-3,945,400) hospitalizations for a cumulative incidence of 1093.9 (992.4-1204.6) hospitalizations per 100,000 population with COVID-19 in the United States from May 2020 through April 2021. Cumulative incidence varied from 359 to 1856 per 100,000 between states. The age group with the highest cumulative incidence was those aged ≥85 years (5575.6; 90% CrI 5066.4-6133.7). The monthly hospitalization rate was highest in December (183.7; 90% CrI 154.3-217.4). Our monthly estimates by state showed variations in magnitudes of peak rates, number of peaks, and timing of peaks between states.

CONCLUSIONS

Our novel approach to estimate hospitalizations for COVID-19 has potential to provide sustainable estimates for monitoring COVID-19 burden as well as a flexible framework leveraging surveillance data.

摘要

背景

在美国,COVID-19 是一种全国性应报告疾病,这意味着各州将病例和住院情况报告给疾病控制与预防中心(CDC)。从美国的每一个设施中识别和报告每一个病例可能在长期内不可行。从现有的监测系统中创建可持续的方法来估计 COVID-19 的负担变得越来越重要。

目的

我们旨在提供一种利用监测数据的方法,为估计 COVID-19 的每月住院率创建一个长期解决方案。

方法

我们使用 COVID-19 相关住院监测网络(COVID-NET)的监测数据和贝叶斯分层模型进行外推,从 2020 年 5 月至 2021 年 4 月,为 50 个州估算 COVID-19 的每月住院率。住院率是根据住院期间或入院前 14 天内进行的实验室确诊 SARS-CoV-2 检测的患者计算得出的。我们为 6 个年龄组(0-17、18-49、50-64、65-74、75-84 和≥85 岁)分别创建了一个模型。我们从多个数据源中确定了随年龄、州和月份而变化的协变量,并根据两种方法(最小绝对收缩和选择算子(LASSO)和尖峰和板条选择方法)为每个年龄组进行协变量选择。我们通过检查模型估计对协变量选择和模型外推的敏感性以及将我们的结果与外部数据进行比较,来验证我们的方法。

结果

我们估计,从 2020 年 5 月至 2021 年 4 月,美国 COVID-19 的累计发病率为每 10 万人中有 1093.9(992.4-1204.6)例住院,累计发病率为 358.31 万(90%可信区间[CrI]325.05 万至 394.54 万)。各州之间的累计发病率从 359 至 1856 例/每 10 万人不等。累计发病率最高的年龄组是≥85 岁的人群(5575.6;90%CrI 5066.4-6133.7)。每月住院率最高的是 12 月(183.7;90%CrI 154.3-217.4)。我们按州估算的每月住院率显示了各州之间峰值幅度、峰值数量和峰值时间的变化。

结论

我们估算 COVID-19 住院率的新方法有可能为监测 COVID-19 负担提供可持续的估计,并为利用监测数据提供灵活的框架。

https://cdn.ncbi.nlm.nih.gov/pmc/blobs/5fa5/9169704/8479e85c5e61/publichealth_v8i6e34296_fig4.jpg
https://cdn.ncbi.nlm.nih.gov/pmc/blobs/5fa5/9169704/ba38b2e3c932/publichealth_v8i6e34296_fig1.jpg
https://cdn.ncbi.nlm.nih.gov/pmc/blobs/5fa5/9169704/619c1f1fb74a/publichealth_v8i6e34296_fig2.jpg
https://cdn.ncbi.nlm.nih.gov/pmc/blobs/5fa5/9169704/92208719994f/publichealth_v8i6e34296_fig3.jpg
https://cdn.ncbi.nlm.nih.gov/pmc/blobs/5fa5/9169704/8479e85c5e61/publichealth_v8i6e34296_fig4.jpg

相似文献

1
Estimating COVID-19 Hospitalizations in the United States With Surveillance Data Using a Bayesian Hierarchical Model: Modeling Study.利用贝叶斯分层模型从监测数据估算美国的 COVID-19 住院人数:建模研究。
JMIR Public Health Surveill. 2022 Jun 2;8(6):e34296. doi: 10.2196/34296.
2
Estimation of US SARS-CoV-2 Infections, Symptomatic Infections, Hospitalizations, and Deaths Using Seroprevalence Surveys.利用血清流行率调查估计美国 SARS-CoV-2 感染、有症状感染、住院和死亡人数。
JAMA Netw Open. 2021 Jan 4;4(1):e2033706. doi: 10.1001/jamanetworkopen.2020.33706.
3
Hospitalization Rates and Characteristics of Patients Hospitalized with Laboratory-Confirmed Coronavirus Disease 2019 - COVID-NET, 14 States, March 1-30, 2020.2020 年 3 月 1 日至 30 日,14 个州住院的经实验室确诊的 2019 冠状病毒病患者的住院率和特征 - COVID-NET。
MMWR Morb Mortal Wkly Rep. 2020 Apr 17;69(15):458-464. doi: 10.15585/mmwr.mm6915e3.
4
Real-time estimation and forecasting of COVID-19 cases and hospitalizations in Wisconsin HERC regions for public health decision making processes.威斯康星州 HERC 地区实时估计和预测 COVID-19 病例和住院情况,以支持公共卫生决策过程。
BMC Public Health. 2023 Feb 17;23(1):359. doi: 10.1186/s12889-023-15160-6.
5
Estimated Incidence of Coronavirus Disease 2019 (COVID-19) Illness and Hospitalization-United States, February-September 2020.2020 年 2 月至 9 月美国新型冠状病毒病(COVID-19)发病和住院估计发病率。
Clin Infect Dis. 2021 Jun 15;72(12):e1010-e1017. doi: 10.1093/cid/ciaa1780.
6
Hospitalization of Adolescents Aged 12-17 Years with Laboratory-Confirmed COVID-19 - COVID-NET, 14 States, March 1, 2020-April 24, 2021.12-17 岁青少年因实验室确诊 COVID-19 住院情况 - COVID-NET,14 个州,2020 年 3 月 1 日-2021 年 4 月 24 日。
MMWR Morb Mortal Wkly Rep. 2021 Jun 11;70(23):851-857. doi: 10.15585/mmwr.mm7023e1.
7
Severity of Disease Among Adults Hospitalized with Laboratory-Confirmed COVID-19 Before and During the Period of SARS-CoV-2 B.1.617.2 (Delta) Predominance - COVID-NET, 14 States, January-August 2021.成人因实验室确诊的 COVID-19 住院的严重程度在 SARS-CoV-2 B.1.617.2(Delta)流行之前和期间-COVID-NET,14 个州,2021 年 1 月至 8 月。
MMWR Morb Mortal Wkly Rep. 2021 Oct 29;70(43):1513-1519. doi: 10.15585/mmwr.mm7043e1.
8
Hospitalization Rates and Characteristics of Children Aged <18 Years Hospitalized with Laboratory-Confirmed COVID-19 - COVID-NET, 14 States, March 1-July 25, 2020.**儿童**:<18 岁,**实验室确诊** COVID-19 住院率及特征——COVID-NET,14 个州,2020 年 3 月 1 日-7 月 25 日。
MMWR Morb Mortal Wkly Rep. 2020 Aug 14;69(32):1081-1088. doi: 10.15585/mmwr.mm6932e3.
9
Clinical Trends Among U.S. Adults Hospitalized With COVID-19, March to December 2020 : A Cross-Sectional Study.2020 年 3 月至 12 月美国因 COVID-19 住院的成年人临床趋势:一项横断面研究。
Ann Intern Med. 2021 Oct;174(10):1409-1419. doi: 10.7326/M21-1991. Epub 2021 Aug 10.
10
Hospitalizations of Children and Adolescents with Laboratory-Confirmed COVID-19 - COVID-NET, 14 States, July 2021-January 2022.儿童和青少年因实验室确诊的 COVID-19 住院-COVID-NET,14 个州,2021 年 7 月-2022 年 1 月。
MMWR Morb Mortal Wkly Rep. 2022 Feb 18;71(7):271-278. doi: 10.15585/mmwr.mm7107e4.

引用本文的文献

1
Risk of post-acute symptoms among adults: A comparison study of severe COVID-19, pneumonia, and influenza.成人急性后症状的风险:一项关于重症新型冠状病毒肺炎、肺炎和流感的比较研究。
PLoS One. 2025 Apr 29;20(4):e0322020. doi: 10.1371/journal.pone.0322020. eCollection 2025.
2
Disparities in COVID-19 Testing and Infection Among Beneficiaries in the Military Health System During the First Year of the Pandemic.疫情第一年军事卫生系统受益者中新冠病毒检测与感染情况的差异
J Racial Ethn Health Disparities. 2025 Feb 21. doi: 10.1007/s40615-025-02315-x.
3
State-Level Influenza Hospitalization Burden in the United States, 2022-2023.

本文引用的文献

1
Monitoring the proportion of the population infected by SARS-CoV-2 using age-stratified hospitalisation and serological data: a modelling study.利用年龄分层的住院和血清学数据监测 SARS-CoV-2 感染人群的比例:一项建模研究。
Lancet Public Health. 2021 Jun;6(6):e408-e415. doi: 10.1016/S2468-2667(21)00064-5. Epub 2021 Apr 8.
2
Estimation of US SARS-CoV-2 Infections, Symptomatic Infections, Hospitalizations, and Deaths Using Seroprevalence Surveys.利用血清流行率调查估计美国 SARS-CoV-2 感染、有症状感染、住院和死亡人数。
JAMA Netw Open. 2021 Jan 4;4(1):e2033706. doi: 10.1001/jamanetworkopen.2020.33706.
3
False-negative results of initial RT-PCR assays for COVID-19: A systematic review.
2022 - 2023年美国各州级流感住院负担
Am J Public Health. 2025 Apr;115(4):546-554. doi: 10.2105/AJPH.2024.307928. Epub 2025 Jan 30.
4
Sleep and cardiorespiratory function assessed by a smart bed over 10 weeks post COVID-19 infection.新冠病毒感染后10周内,通过智能床评估睡眠和心肺功能。
Sci Rep. 2025 Jan 21;15(1):2724. doi: 10.1038/s41598-025-87069-6.
5
Virginia Memory Project: Using the Healthy Brain Initiative Roadmap to design a statewide dementia registry.弗吉尼亚记忆项目:利用健康大脑计划路线图设计全州范围的痴呆症登记处。
Alzheimers Dement. 2025 Feb;21(2):e14478. doi: 10.1002/alz.14478. Epub 2025 Jan 16.
6
The effects of deprivation, age, and regional differences in COVID-19 mortality from 2020 to 2022: a retrospective analysis of public provincial data.2020年至2022年新冠病毒病死亡中贫困、年龄及地区差异的影响:省级公共数据的回顾性分析
BMC Public Health. 2025 Jan 14;25(1):148. doi: 10.1186/s12889-024-21031-5.
7
Impact of Age and Comorbid Conditions on Incidence Rates of COVID-19-Associated Hospitalizations, 2020-2021.2020-2021 年年龄和合并症对 COVID-19 相关住院发病率的影响。
Influenza Other Respir Viruses. 2024 Nov;18(11):e70016. doi: 10.1111/irv.70016.
8
Pharmacovigilance of Drug-Drug Interactions with Nirmatrelvir/Ritonavir.奈玛特韦/利托那韦药物相互作用的药物警戒
Infect Dis Ther. 2024 Dec;13(12):2545-2561. doi: 10.1007/s40121-024-01050-w. Epub 2024 Oct 26.
9
Extrapolating Sentinel Surveillance Information to Estimate National COVID Hospital Admission Rates: A Bayesian Modeling Approach.从哨点监测信息推断全国 COVID 住院率:贝叶斯建模方法。
Influenza Other Respir Viruses. 2024 Oct;18(10):e70026. doi: 10.1111/irv.70026.
10
Wastewater-Based Surveillance Reveals the Effectiveness of the First COVID-19 Vaccination Campaigns in Assisted Living Facilities.污水监测揭示了新冠病毒第一次疫苗接种活动在辅助生活设施中的效果。
Int J Environ Res Public Health. 2024 Sep 23;21(9):1259. doi: 10.3390/ijerph21091259.
COVID-19 初始 RT-PCR 检测的假阴性结果:系统评价。
PLoS One. 2020 Dec 10;15(12):e0242958. doi: 10.1371/journal.pone.0242958. eCollection 2020.
4
Estimated Incidence of Coronavirus Disease 2019 (COVID-19) Illness and Hospitalization-United States, February-September 2020.2020 年 2 月至 9 月美国新型冠状病毒病(COVID-19)发病和住院估计发病率。
Clin Infect Dis. 2021 Jun 15;72(12):e1010-e1017. doi: 10.1093/cid/ciaa1780.
5
Living risk prediction algorithm (QCOVID) for risk of hospital admission and mortality from coronavirus 19 in adults: national derivation and validation cohort study.成人因冠状病毒 19 住院和死亡风险的生存风险预测算法(QCOVID):全国推导和验证队列研究。
BMJ. 2020 Oct 20;371:m3731. doi: 10.1136/bmj.m3731.
6
Estimated County-Level Prevalence of Selected Underlying Medical Conditions Associated with Increased Risk for Severe COVID-19 Illness - United States, 2018.估计与 COVID-19 重症风险增加相关的选定基础医疗条件在县一级的流行率 - 美国,2018 年。
MMWR Morb Mortal Wkly Rep. 2020 Jul 24;69(29):945-950. doi: 10.15585/mmwr.mm6929a1.
7
Estimates of global seasonal influenza-associated respiratory mortality: a modelling study.全球季节性流感相关呼吸道死亡率的估计:一项建模研究。
Lancet. 2018 Mar 31;391(10127):1285-1300. doi: 10.1016/S0140-6736(17)33293-2. Epub 2017 Dec 14.
8
The US Influenza Hospitalization Surveillance Network.美国流感住院监测网络。
Emerg Infect Dis. 2015 Sep;21(9):1543-50. doi: 10.3201/eid2109.141912.
9
Deaths: final data for 2009.死亡情况:2009年最终数据。
Natl Vital Stat Rep. 2011 Dec 29;60(3):1-116.