Hahn Andrew W, Dizman Nazli, Msaouel Pavlos
Division of Cancer Medicine, The University of Texas MD Anderson Cancer Center, Houston, TX, USA.
Department of Internal Medicine, Yale University School of Medicine, New Haven, CT, USA.
Ther Adv Med Oncol. 2022 Jun 1;14:17588359221103199. doi: 10.1177/17588359221103199. eCollection 2022.
Oncologists often refer to forest plots to determine which patient subgroups may be more likely to benefit from a therapy tested in a randomized clinical trial (RCT). We sought to empirically determine the information content of subgroup comparisons from forest plots of RCTs.
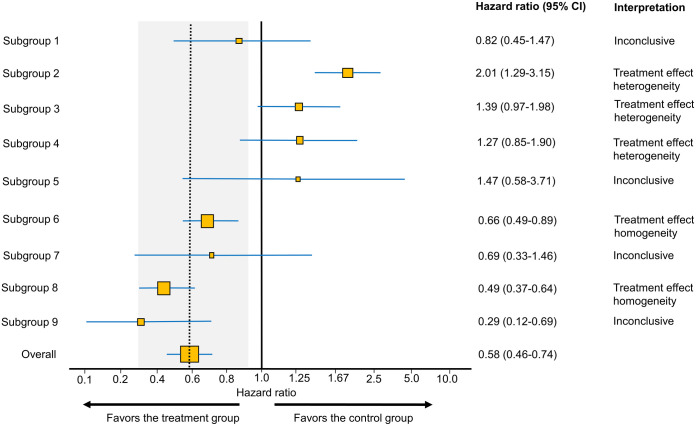
We assessed all forest plots from RCTs of therapeutic interventions presented orally at the American Society of Clinical Oncology Annual Meetings in 2020 and 2021. Subgroups were considered as showing evidence of treatment effect heterogeneity in forest plots when their confidence intervals (CIs) did not overlap with the vertical line corresponding to the main effect observed in the overall RCT cohort. Subgroups were considered as showing evidence of treatment effect homogeneity in forest plots when their CIs did not meaningfully differ, within 80-125% equivalence range, with the values compatible with the main effect. All other subgroups were considered as inconclusive.
A total of 99 forest plots were presented, and only 24.2% contained one or more subgroups suggestive of treatment effect heterogeneity. A total of 81 forest plots provided enough information to evaluate treatment effect heterogeneity and homogeneity. These 81 forest plots represented a total of 1344 individual subgroups, of which 57.2% were inconclusive, 41.1% showed evidence of treatment effect homogeneity, and 1.6% yielded evidence suggestive of treatment effect heterogeneity.
The majority of subgroup comparisons were inconclusive in this empirical analysis of forest plots used in oncology RCTs. Different strategies should be considered to improve the estimation and representation of subgroup-specific effects.
肿瘤学家经常参考森林图来确定哪些患者亚组可能更有可能从随机临床试验(RCT)中测试的治疗中获益。我们试图通过实证研究确定RCT森林图中亚组比较的信息含量。
我们评估了2020年和2021年美国临床肿瘤学会年会上口头展示的治疗性干预RCT的所有森林图。当亚组的置信区间(CI)与总体RCT队列中观察到的主要效应对应的垂直线不重叠时,认为亚组在森林图中显示出治疗效果异质性的证据。当亚组的CI在80 - 125%等效范围内与与主要效应兼容的值没有显著差异时,认为亚组在森林图中显示出治疗效果同质性的证据。所有其他亚组被认为是不确定的。
共展示了99个森林图,只有24.2%包含一个或多个提示治疗效果异质性的亚组。共有81个森林图提供了足够的信息来评估治疗效果的异质性和同质性。这81个森林图总共代表了1344个个体亚组,其中57.2%是不确定的,41.1%显示出治疗效果同质性的证据,1.6%产生了提示治疗效果异质性的证据。
在这项对肿瘤学RCT中使用的森林图的实证分析中,大多数亚组比较是不确定的。应考虑采用不同策略来改进亚组特异性效应的估计和呈现。