Research Department of Epidemiology and Public Health, University College London, London, United Kingdom.
PLoS One. 2012;7(12):e50606. doi: 10.1371/journal.pone.0050606. Epub 2012 Dec 5.
Official reports on modal risk have not chosen appropriate numerators and denominators to enable like-for-like comparisons. We report age- and sex-specific deaths and injury rates from equivalent incidents in England by travel mode, distance travelled and time spent travelling.
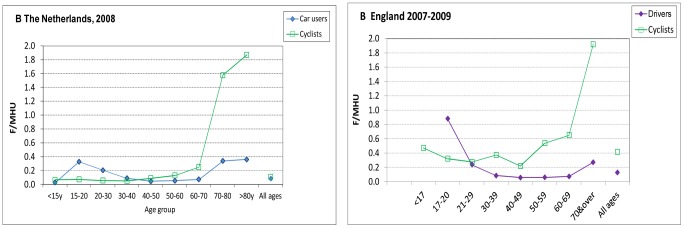
Hospital admissions and deaths in England 2007-2009 were obtained for relevant ICD-10 external codes for pedestrians, cyclists, and car/van drivers, by age-group and sex. Distance travelled by age-group, sex and mode in England (National Travel Survey 2007-2009 data) was converted to time spent travelling using mean trip speeds. Fatality rates were compared with age-specific Netherlands data.
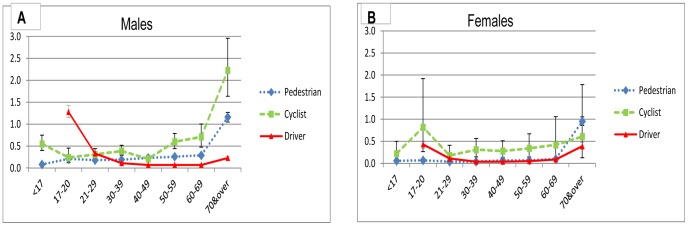
All-age fatalities per million hours' use (f/mhu) varied over the same factor-of-three range for both sexes (0.15-0.45 f/mhu by mode for men, 0.09-0.31 f/mhu for women). Risks were similar for men aged 21-49 y for all three modes and for female pedestrians and drivers aged 21-69 y. Most at risk were: males 17-20 y (1.3 f/mhu (95% CI 1.2-1.4)) for driving; males 70+ (2.2 f/mhu(1.6-3.0)) for cycling; and females 70+ (0.95 f/mhu (0.86-1.1)) for pedestrians. In general, fatality rates were substantially higher among males than females. Risks per hour for male drivers <30 y were similar or higher than for male cyclists; for males aged 17-20 y, the risk was higher for drivers (33/Bn km (30-36), 1.3 f/mhu (1.2-1.4)) than cyclists (20/Bn km (10-37), 0.24 f/mhu (0.12-0.45)) whether using distance or time. Similar age patterns occurred for cyclists and drivers in the Netherlands. Age-sex patterns for injuries resulting in hospital admission were similar for cyclists and pedestrians but lower for drivers.
When all relevant ICD-10 codes are used, fatalities by time spent travelling vary within similar ranges for walking, cycling and driving. Risks for drivers were highest in youth and fell with age, while for pedestrians and cyclists, risks increased with age. For the young, especially males, cycling is safer than driving.
官方关于模态风险的报告并未选择合适的分子和分母来进行同类比较。我们报告了英格兰按出行模式、行驶距离和行驶时间划分的、具有年龄和性别特异性的死亡和伤害发生率。
获取了英格兰 2007-2009 年与行人、骑自行车者和汽车/货车司机相关的国际疾病分类第 10 版(ICD-10)外部代码的住院和死亡病例,按年龄组和性别进行分类。使用平均行程速度将英格兰的年龄组、性别和模式的行驶距离(2007-2009 年全国旅行调查数据)转换为行驶时间。死亡率与特定年龄的荷兰数据进行比较。
在同一范围内,男女每百万小时使用的全年龄段死亡率(f/mhu)相差三倍(男性模式下 0.15-0.45 f/mhu,女性 0.09-0.31 f/mhu)。三种模式下,21-49 岁的男性风险相似,21-69 岁的女性行人和司机的风险也相似。风险最高的是:17-20 岁的男性(驾驶 1.3 f/mhu(95%置信区间 1.2-1.4));70 岁以上的男性(骑自行车 2.2 f/mhu(1.6-3.0));70 岁以上的女性(步行 0.95 f/mhu(0.86-1.1))。一般来说,男性的死亡率明显高于女性。30 岁以下男性驾驶员的每小时风险与男性骑自行车者相似或更高;对于 17-20 岁的男性,驾驶员的风险更高(33/Bn km(30-36),1.3 f/mhu(1.2-1.4)),而骑自行车者(20/Bn km(10-37),0.24 f/mhu(0.12-0.45))。荷兰的自行车手和驾驶员也出现了类似的年龄模式。导致住院的受伤事件的年龄-性别模式在骑自行车者和行人中相似,但在驾驶员中较低。
当使用所有相关的 ICD-10 代码时,按行驶时间计算的死亡率在步行、骑自行车和驾驶之间的变化范围相似。驾驶员的风险在青年时期最高,并随年龄下降,而对于行人和骑自行车者,风险随年龄增加而增加。对于年轻人,尤其是男性来说,骑自行车比开车更安全。