Prevention Research Center, Pacific Institute for Research and Evaluation, Oakland, California.
Alcohol Clin Exp Res. 2018 Jun;42(6):1113-1121. doi: 10.1111/acer.13758. Epub 2018 May 20.
Past research has linked alcohol outlet densities to drinking, drunken driving, and alcohol-related motor vehicle crashes (MVCs). Because impaired drivers travel some distances from drinking places to crash locations, spatial relationships between outlets and crashes are complex. We investigate these relationships at 3 geographic levels: census block groups (CBGs), adjacent (nearby) areas, and whole cities.
We examined risks of all injury MVCs as well as "had been drinking" (HBD) and single-vehicle-nighttime (SVN) subgroups using data from the Statewide Integrated Traffic Records System across CBGs among 50 California cities from 2001 to 2008. Relationships between outlet densities at the city level, within CBGs, and in adjacent CBGs and crashes were examined using Bayesian Poisson space-time analyses controlling for population size income and other demographics (all as covariates).
All injury MVCs were positively related to adjacent CBG population size (relative rate [RR] = 1.008, 95% credible interval (CI) = 1.004, 1.012), and outlet densities at CBG (RR = 1.027, CI = 1.020, 1.035), nearby area (RR = 1.084, CI = 1.060, 1.106) and city levels (RR = 1.227, CI = 1.147, 1.315), and proportion of bars or pubs at the city level (RR = 2.257, CI = 1.187, 4.125). HBD and SVN crashes were comparatively less frequent in high outlet density CBG (RR = 0.993, CI = 0.987, 0.999; RR = 0.963, CI = 0.951, 0.975) and adjacent areas (RR = 0.979, CI = 0.962, 0.996; RR = 0.909, CI = 0.883, 0.936), but positively associated with city-level proportions of bars (RR = 3.373, CI = 0.736, 15.644; RR = 10.322, CI = 1.704, 81.215). Overall, a 10% increase in all outlets was related to 2.8% more injury crashes (CI = 2.3, 3.3) and 2.5% more HBDs (CI = 1.7, 3.3). A 10% increase in bars was related to 1.4% more crashes, 4.3% more HBDs, and 10.3% more SVNs.
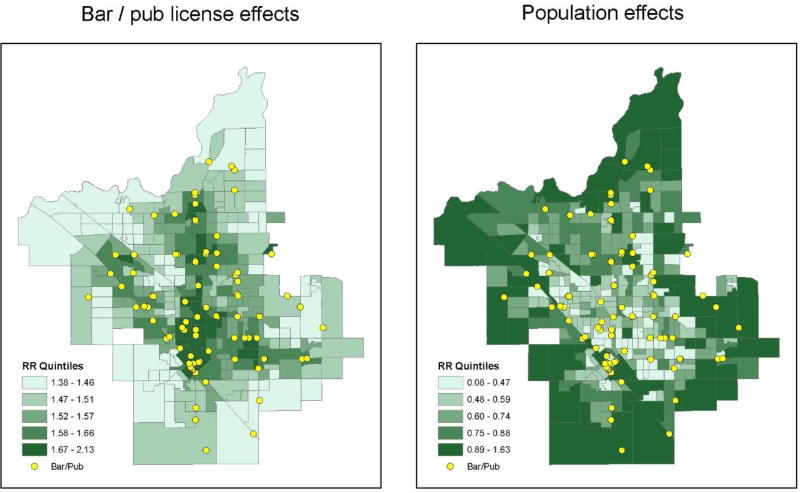
Population size and densities of bars or pubs were found to be associated with crash rates, with population effects appearing across cities and outlet effects appearing within dense downtown areas. Summary estimates of outlet and population impacts on MVCs must consider varying contributions at multiple spatial scales.
过去的研究表明,酒类销售点的密度与饮酒、酒后驾车和与酒精有关的机动车事故(MVC)有关。由于受影响的司机从饮酒场所行驶到事故地点,因此网点与事故之间的空间关系较为复杂。我们在 3 个地理水平上研究这些关系:人口普查街区组(CBG)、相邻(附近)区域和整个城市。
我们使用加利福尼亚州 50 个城市 2001 年至 2008 年全州综合交通记录系统中来自相邻 CBG 的数据,对所有伤害 MVC 以及“曾经饮酒”(HBD)和单车辆夜间(SVN)亚组的风险进行了检查。使用贝叶斯泊松时空分析,控制人口规模、收入和其他人口统计学因素(均为协变量),研究城市层面、CBG 内部和相邻 CBG 中网点密度与事故之间的关系。
所有伤害 MVC 与相邻 CBG 的人口规模呈正相关(相对比率[RR] = 1.008,95%置信区间[CI] = 1.004,1.012),与 CBG 内的网点密度(RR = 1.027,CI = 1.020,1.035)、附近区域(RR = 1.084,CI = 1.060,1.106)和城市层面(RR = 1.227,CI = 1.147,1.315)以及城市层面酒吧或酒馆的比例呈正相关(RR = 2.257,CI = 1.187,4.125)。高网点密度 CBG(RR = 0.993,CI = 0.987,0.999;RR = 0.963,CI = 0.951,0.975)和相邻区域(RR = 0.979,CI = 0.962,0.996;RR = 0.909,CI = 0.883,0.936)中 HBD 和 SVN 事故的发生率相对较低,但与城市层面酒吧的比例呈正相关(RR = 3.373,CI = 0.736,15.644;RR = 10.322,CI = 1.704,81.215)。总体而言,所有网点增加 10%,则与伤害性事故增加 2.8%(CI = 2.3,3.3)和 HBD 增加 2.5%(CI = 1.7,3.3)有关。酒吧数量增加 10%,与车祸增加 1.4%、HBD 增加 4.3%和 SVN 增加 10.3%有关。
人口规模和酒吧或酒馆的密度与事故发生率有关,人口效应出现在各个城市,网点效应出现在人口密集的市中心地区。对 MVC 影响的网点和人口的汇总估计必须考虑多个空间尺度上的不同贡献。