Department of Ophthalmology, University of Washington, Seattle.
Moorfields Eye Hospital National Health Service Foundation Trust, London, United Kingdom.
JAMA Netw Open. 2019 Feb 1;2(2):e188029. doi: 10.1001/jamanetworkopen.2018.8029.
As currently used, microperimetry is a burdensome clinical testing modality for testing retinal sensitivity requiring long testing times and trained technicians.
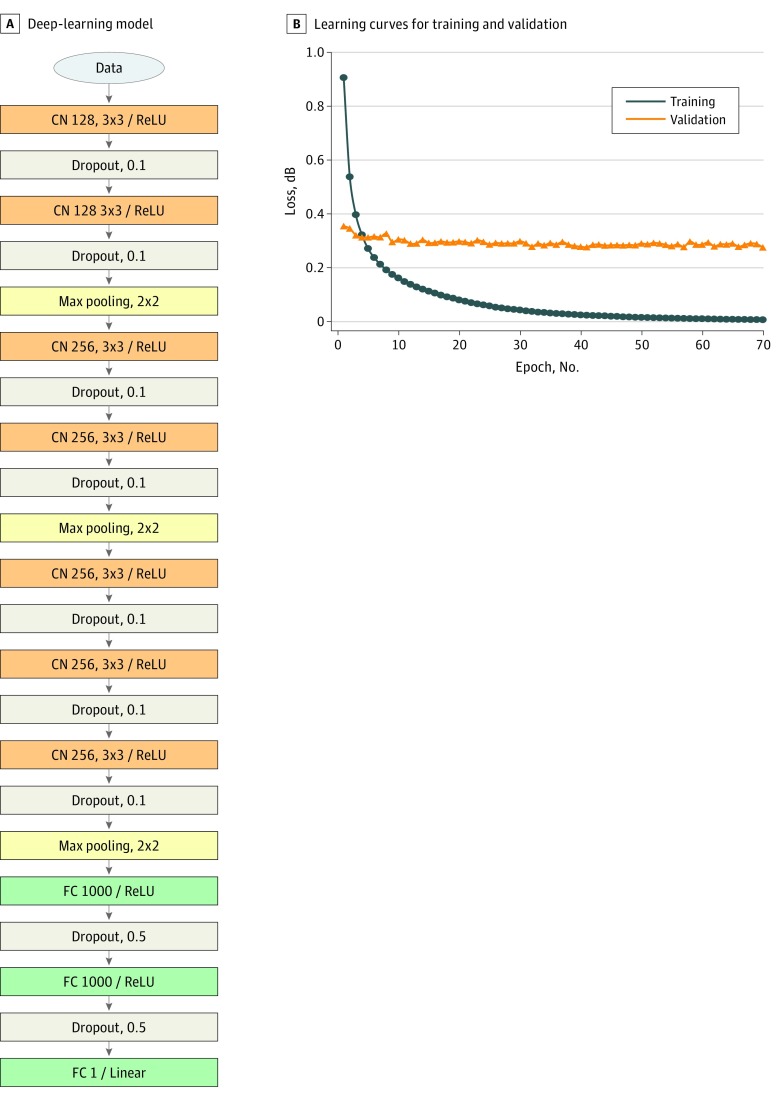
To create a deep-learning network that could directly estimate function from structure de novo to provide an en face high-resolution map of estimated retinal sensitivity.
DESIGN, SETTING, AND PARTICIPANTS: A cross-sectional imaging study using data collected between January 1, 2016, and November 30, 2017, from the Natural History Observation and Registry of macular telangiectasia type 2 (MacTel) evaluated 38 participants with confirmed MacTel from 2 centers.
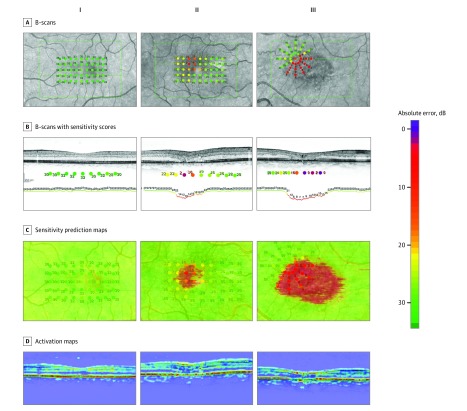
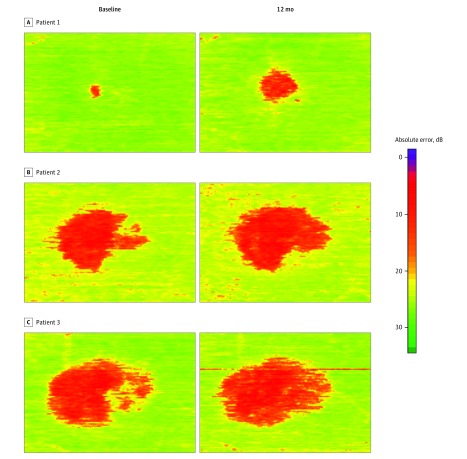
Mean absolute error of estimated compared with observed retinal sensitivity. Observed retinal sensitivity was obtained with fundus-controlled perimetry (microperimetry). Estimates of retinal sensitivity were made with deep-learning models that learned on superpositions of high-resolution optical coherence tomography (OCT) scans and microperimetry results. Those predictions were used to create high-density en face sensitivity maps of the macula. Training, validation, and test sets were segregated at the patient level.
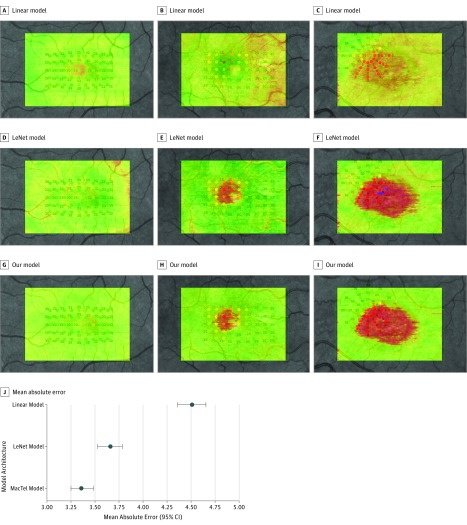
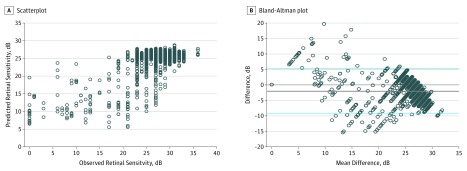
A total of 2499 microperimetry sensitivities were mapped onto 1708 OCT B-scans from 63 eyes of 38 patients (mean [SD] age, 74.3 [9.7] years; 15 men [39.5%]). The numbers of examples for our algorithm were 67 899 (103 053 after data augmentation) for training, 1695 for validation, and 1212 for testing. Mean absolute error results were 4.51 dB (95% CI, 4.36-4.65 dB) when using linear regression and 3.66 dB (95% CI, 3.53-3.78 dB) when using the LeNet model. Using a 49.9 million-variable deep-learning model, a mean absolute error of 3.36 dB (95% CI, 3.25-3.48 dB) of retinal sensitivity for validation and test was achieved. Correlation showed a high degree of agreement (Pearson correlation r = 0.78). By paired Wilcoxon rank sum test, our model significantly outperformed these 2 baseline models (P < .001).
High-resolution en face maps of estimated retinal sensitivities were created in eyes with MacTel. The maps were of unequalled resolution compared with microperimetry and were able to correctly delineate functionally healthy and impaired retina. This model may be useful to monitor structural and functional disease progression and has potential as an objective surrogate outcome measure in investigational trials.
目前,微视野检查是一种繁琐的临床测试方法,用于测试视网膜敏感度,需要长时间的测试和训练有素的技术人员。
创建一个深度学习网络,可以直接从结构中估计功能,提供估计的视网膜敏感度的高分辨率面图。
设计、设置和参与者:一项横断面成像研究使用了 2016 年 1 月 1 日至 2017 年 11 月 30 日期间收集的数据,评估了来自 2 个中心的 38 名确诊为 MacTel 的参与者,这些参与者的数据来自自然史观察和 2 型黄斑毛细血管扩张症(MacTel)的登记处。
与观察到的视网膜敏感度相比,估计的平均绝对误差。观察到的视网膜敏感度是通过眼底控制的视野检查(微视野检查)获得的。通过深度学习模型对高分辨率光学相干断层扫描(OCT)扫描和微视野检查结果的叠加进行估计。这些预测被用于创建黄斑的高密度面图敏感性地图。在患者水平上分离了训练、验证和测试集。
共将 2499 个微视野敏感度映射到来自 38 名患者 63 只眼的 1708 个 OCT B 扫描(平均[SD]年龄,74.3[9.7]岁;15 名男性[39.5%])。我们算法的示例数量为 67899 个(数据扩充后为 103053 个)用于训练,1695 个用于验证,1212 个用于测试。使用线性回归的平均绝对误差结果为 4.51dB(95%置信区间,4.36-4.65dB),使用 LeNet 模型的平均绝对误差为 3.66dB(95%置信区间,3.53-3.78dB)。使用 4990 万个变量的深度学习模型,在验证和测试中实现了 3.36dB(95%置信区间,3.25-3.48dB)的视网膜敏感度的平均绝对误差。相关性显示出高度的一致性(Pearson 相关 r=0.78)。通过配对 Wilcoxon 秩和检验,我们的模型明显优于这两个基线模型(P<0.001)。
在患有 MacTel 的眼睛中创建了估计的视网膜敏感度的高分辨率面图。与微视野检查相比,这些地图具有无与伦比的分辨率,并且能够正确描绘功能正常和受损的视网膜。该模型可能有助于监测结构和功能疾病的进展,并有可能成为研究试验中的客观替代终点测量指标。