• 文献检索
  • 文档翻译
  • 深度研究
  • 学术资讯
  • Suppr Zotero 插件Zotero 插件
  • 邀请有礼
  • 套餐&价格
  • 历史记录
应用&插件
Suppr Zotero 插件Zotero 插件浏览器插件Mac 客户端Windows 客户端微信小程序
定价
高级版会员购买积分包购买API积分包
服务
文献检索文档翻译深度研究API 文档MCP 服务
关于我们
关于 Suppr公司介绍联系我们用户协议隐私条款
关注我们

Suppr 超能文献

核心技术专利:CN118964589B侵权必究
粤ICP备2023148730 号-1Suppr @ 2026

文献检索

告别复杂PubMed语法,用中文像聊天一样搜索,搜遍4000万医学文献。AI智能推荐,让科研检索更轻松。

立即免费搜索

文件翻译

保留排版,准确专业,支持PDF/Word/PPT等文件格式,支持 12+语言互译。

免费翻译文档

深度研究

AI帮你快速写综述,25分钟生成高质量综述,智能提取关键信息,辅助科研写作。

立即免费体验

评估 1999-2016 年美国不同类阿片相关死亡率的地理分布变化及其与阿片类药物的关系。

Assessment of Changes in the Geographical Distribution of Opioid-Related Mortality Across the United States by Opioid Type, 1999-2016.

机构信息

Center for Population Health Sciences, Stanford University School of Medicine, Stanford, California.

Center for Primary Care, Harvard Medical School, Boston, Massachusetts.

出版信息

JAMA Netw Open. 2019 Feb 1;2(2):e190040. doi: 10.1001/jamanetworkopen.2019.0040.

DOI:10.1001/jamanetworkopen.2019.0040
PMID:30794299
原文链接:https://pmc.ncbi.nlm.nih.gov/articles/PMC6484620/
Abstract

IMPORTANCE

As the opioid epidemic evolves, it is vital to identify changes in the geographical distribution of opioid-related deaths, and the specific opioids to which those deaths are attributed, to ensure that federal and state public health interventions remain appropriately targeted.

OBJECTIVE

To identify changes in the geographical distribution of opioid-related mortality across the United States by opioid type.

DESIGN, SETTING, AND PARTICIPANTS: Cross-sectional study using joinpoint modeling and life table analysis of individual-level data from the National Center for Health Statistics on 351 630 US residents who died from opioid-related causes from January 1, 1999, to December 31, 2016, for all of the United States and the District of Columbia. The analysis was conducted from September 6 to November 23, 2018.

EXPOSURES

Deaths involving any opioid, heroin, synthetic opioids, and natural and semisynthetic opioids.

MAIN OUTCOMES AND MEASURES

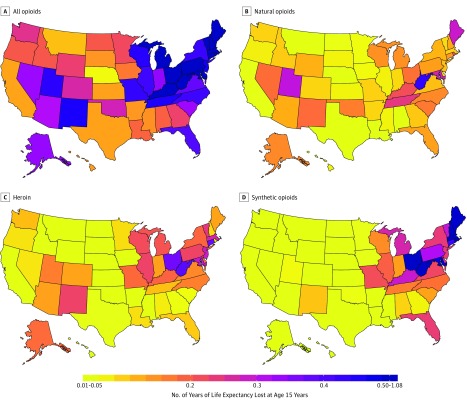
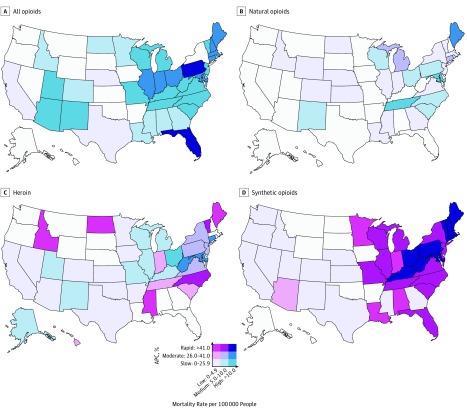
Opioid-related mortality rate, annual percent change in the opioid-related mortality rate, and life expectancy lost at age 15 years by state and opioid type.

RESULTS

From 1999 to 2016, a total of 231 264 men and 120 366 women died from opioid-related causes across the whole United States. Sixty-six observations were removed owing to missing data on age; therefore, 351 564 US residents were included in this study. The mean (SD) age at death was 39.8 (12.5) years for men and was 43.5 (12.9) years from women. Opioid-related mortality rates, especially from synthetic opioids, rapidly increased in all of the eastern United States. In most states, mortality associated with natural and semisynthetic opioids (ie, prescription painkillers) remained stable. In contrast, 28 states had mortality rates from synthetic opioids that more than doubled every 2 years (ie, annual percent change, ≥41%), including 12 with high mortality rates from synthetic opioids (>10 per 100 000 people). Among these 28 states, the mortality rate from natural and semisynthetic opioids ranged from 2.0 to 18.7 per 100 000 people (with a mean mortality rate of 6.0 per 100 000 people). The District of Columbia had the fastest rate of increase in mortality from opioids, more than tripling every year since 2013 (annual percent change, 228.3%; 95% CI, 169.7%-299.6%; P < .001), and a high mortality rate from synthetic opioids in 2016 (18.8 per 100 000 people); the mortality rate from natural and semisynthetic opioids was 6.9 per 100 000 people. Nationally, overall opioid-related mortality resulted in 0.36 years of life expectancy lost in 2016, which was 14% higher than deaths due to firearms and 18% higher than deaths due to motor vehicle crashes; 0.17 years of the life expectancy lost was due specifically to synthetic opioids. In 2016, New Hampshire and West Virginia lost more than 1 year of life expectancy due to opioid-related mortality.

CONCLUSIONS AND RELEVANCE

Opioid-related mortality, particularly mortality associated with synthetic opioids, has increased in the eastern United States. These findings indicate that policies focused on reducing opioid-related deaths may need to prioritize synthetic opioids and rapidly expanding epidemics in northeastern states and consider the potential for synthetic opioid epidemics outside of the heroin supply.

https://cdn.ncbi.nlm.nih.gov/pmc/blobs/864e/6484620/3dfb1d193352/jamanetwopen-2-e190040-g002.jpg
https://cdn.ncbi.nlm.nih.gov/pmc/blobs/864e/6484620/1121a64ef082/jamanetwopen-2-e190040-g001.jpg
https://cdn.ncbi.nlm.nih.gov/pmc/blobs/864e/6484620/3dfb1d193352/jamanetwopen-2-e190040-g002.jpg
https://cdn.ncbi.nlm.nih.gov/pmc/blobs/864e/6484620/1121a64ef082/jamanetwopen-2-e190040-g001.jpg
https://cdn.ncbi.nlm.nih.gov/pmc/blobs/864e/6484620/3dfb1d193352/jamanetwopen-2-e190040-g002.jpg
摘要

重要性

随着阿片类药物流行的演变,确定阿片类药物相关死亡的地理分布变化以及归因于这些死亡的特定阿片类药物至关重要,以确保联邦和州公共卫生干预措施仍然有针对性。

目的

通过阿片类药物的类型,确定美国阿片类药物相关死亡率的地理分布变化。

设计、地点和参与者:使用国家卫生统计中心关于 1999 年 1 月 1 日至 2016 年 12 月 31 日期间因阿片类药物相关原因死亡的 351564 名美国居民的个体水平数据的联合点建模和生命表分析进行横断面研究,这些居民来自美国和哥伦比亚特区的所有地区。分析于 2018 年 9 月 6 日至 11 月 23 日进行。

暴露

涉及任何阿片类药物、海洛因、合成阿片类药物以及天然和半合成阿片类药物的死亡。

主要结果和措施

按州和阿片类药物类型划分的阿片类药物相关死亡率、阿片类药物相关死亡率的年变化百分比以及 15 岁时的预期寿命损失。

结果

1999 年至 2016 年,全美国共有 231264 名男性和 120366 名女性因阿片类药物相关原因死亡。由于年龄数据缺失,有 66 个观察值被删除;因此,共有 351564 名美国居民纳入本研究。男性的平均(SD)死亡年龄为 39.8(12.5)岁,女性为 43.5(12.9)岁。阿片类药物相关死亡率,尤其是合成阿片类药物的死亡率,在美国东部各州迅速上升。在大多数州,与天然和半合成阿片类药物(即处方止痛药)相关的死亡率保持稳定。相比之下,28 个州的合成阿片类药物死亡率每两年翻一番以上(即年变化百分比≥41%),其中 12 个州的合成阿片类药物死亡率很高(>10/10 万)。在这 28 个州中,合成阿片类药物的死亡率范围为每 10 万人 2.0 至 18.7 例(平均死亡率为每 10 万人 6.0 例)。哥伦比亚特区的阿片类药物死亡率增长最快,自 2013 年以来每年增长超过两倍(年变化百分比 228.3%;95%CI,169.7%-299.6%;P<0.001),2016 年合成阿片类药物死亡率较高(每 10 万人 18.8 例);天然和半合成阿片类药物的死亡率为每 10 万人 6.9 例。在全国范围内,阿片类药物相关死亡率导致 2016 年预期寿命损失 0.36 年,比枪支死亡率高 14%,比机动车碰撞死亡率高 18%;其中 0.17 年的预期寿命损失是由于合成阿片类药物造成的。2016 年,新罕布什尔州和西弗吉尼亚州因阿片类药物相关死亡而损失的预期寿命超过 1 年。

结论和相关性

阿片类药物相关死亡率,特别是与合成阿片类药物相关的死亡率,在美国东部各州有所增加。这些发现表明,旨在减少阿片类药物相关死亡的政策可能需要优先考虑合成阿片类药物和东北地区迅速扩大的流行,并考虑到海洛因供应以外的合成阿片类药物流行的可能性。

相似文献

1
Assessment of Changes in the Geographical Distribution of Opioid-Related Mortality Across the United States by Opioid Type, 1999-2016.评估 1999-2016 年美国不同类阿片相关死亡率的地理分布变化及其与阿片类药物的关系。
JAMA Netw Open. 2019 Feb 1;2(2):e190040. doi: 10.1001/jamanetworkopen.2019.0040.
2
Association of Medicaid Expansion With Opioid Overdose Mortality in the United States.美国医疗补助扩张与阿片类药物过量死亡率的关联。
JAMA Netw Open. 2020 Jan 3;3(1):e1919066. doi: 10.1001/jamanetworkopen.2019.19066.
3
Systematic Evaluation of State Policy Interventions Targeting the US Opioid Epidemic, 2007-2018.系统评价针对美国阿片类药物流行的国家政策干预措施,2007-2018 年。
JAMA Netw Open. 2021 Feb 1;4(2):e2036687. doi: 10.1001/jamanetworkopen.2020.36687.
4
The Burden of Opioid-Related Mortality in the United States.美国阿片类药物相关死亡率负担。
JAMA Netw Open. 2018 Jun 1;1(2):e180217. doi: 10.1001/jamanetworkopen.2018.0217.
5
Increases in Drug and Opioid Overdose Deaths--United States, 2000-2014.药物和阿片类药物过量死亡人数增加 - 美国,2000-2014 年。
MMWR Morb Mortal Wkly Rep. 2016 Jan 1;64(50-51):1378-82. doi: 10.15585/mmwr.mm6450a3.
6
US National Trends in Pediatric Deaths From Prescription and Illicit Opioids, 1999-2016.美国 1999-2016 年儿童因处方和非法阿片类药物死亡的国家趋势。
JAMA Netw Open. 2018 Dec 7;1(8):e186558. doi: 10.1001/jamanetworkopen.2018.6558.
7
Drug and Opioid-Involved Overdose Deaths - United States, 2013-2017.药物和阿片类药物滥用相关的过量死亡-美国,2013-2017 年。
MMWR Morb Mortal Wkly Rep. 2018 Jan 4;67(5152):1419-1427. doi: 10.15585/mmwr.mm675152e1.
8
Overdose deaths from nonprescribed prescription opioids, heroin, and other synthetic opioids in Medicare beneficiaries.医疗保险受益人中因非处方类处方阿片类药物、海洛因及其他合成阿片类药物导致的过量用药死亡情况。
J Subst Abuse Treat. 2021 May;124:108282. doi: 10.1016/j.jsat.2021.108282. Epub 2021 Jan 7.
9
Analysis of Urine Drug Test Results From Substance Use Disorder Treatment Practices and Overdose Mortality Rates, 2013-2020.2013-2020 年物质使用障碍治疗实践和过量死亡率的尿液药物检测结果分析。
JAMA Netw Open. 2022 Jun 1;5(6):e2215425. doi: 10.1001/jamanetworkopen.2022.15425.
10
Changing Trends in Opioid Overdose Deaths and Prescription Opioid Receipt Among Veterans.退伍军人中阿片类药物过量死亡和处方阿片类药物使用的变化趋势。
Am J Prev Med. 2019 Jul;57(1):106-110. doi: 10.1016/j.amepre.2019.01.016. Epub 2019 May 22.

引用本文的文献

1
Differences and similarities between the genetic architecture of lifetime substance use across different substances.不同物质终生物质使用的遗传结构之间的差异与相似之处。
Psychol Med. 2025 Jul 30;55:e219. doi: 10.1017/S0033291725101293.
2
A Systematic Review of Knowledge and Attitude of Nurses Towards Substance Use or Users.护士对药物使用或使用者的知识与态度的系统评价
Addict Health. 2024 Oct;16(4):297-304. doi: 10.34172/ahj.1326. Epub 2024 Oct 29.
3
Recent Drug Overdose Mortality Decline Compared With Pre-COVID-19 Trend.与新冠疫情前趋势相比,近期药物过量死亡率下降情况

本文引用的文献

1
United States Life Tables, 2015.《2015年美国生命表》
Natl Vital Stat Rep. 2018 Nov;67(7):1-64.
2
Changing dynamics of the drug overdose epidemic in the United States from 1979 through 2016.美国 1979 年至 2016 年期间药物过量流行的动态变化。
Science. 2018 Sep 21;361(6408). doi: 10.1126/science.aau1184.
3
Trends in Black and White Opioid Mortality in the United States, 1979-2015.美国 1979-2015 年黑人和白人阿片类药物死亡率趋势。
JAMA Netw Open. 2025 Feb 3;8(2):e2458090. doi: 10.1001/jamanetworkopen.2024.58090.
4
Natural Products with Potential for the Treatment of Pain: Global Evidence from the NAPRALERT Database.具有治疗疼痛潜力的天然产物:NAPRALERT 数据库的全球证据。
J Nat Prod. 2024 Nov 22;87(11):2665-2675. doi: 10.1021/acs.jnatprod.4c00439. Epub 2024 Oct 29.
5
The Imperative of Regulation: The Co-creation of a Medical and Non-medical US Opioid Crisis.监管的必要性:美国医疗与非医疗阿片类药物危机的共同形成
Psychoactives. 2023 Nov 3;2(4):317-336. doi: 10.3390/psychoactives2040020.
6
A state-level history of opioid overdose deaths in the United States: 1999-2021.美国州级阿片类药物过量死亡史:1999-2021 年。
PLoS One. 2024 Sep 6;19(9):e0309938. doi: 10.1371/journal.pone.0309938. eCollection 2024.
7
Knowledge of medications for opioid use disorder and associated stigma among primary care professionals.阿片类药物使用障碍相关药物知识及初级保健专业人员的相关耻辱感。
Ann Med. 2024 Dec;56(1):2399316. doi: 10.1080/07853890.2024.2399316. Epub 2024 Sep 5.
8
Opioid Prescriptions for US Patients Undergoing Long-Term Dialysis or with Kidney Transplant from 2011 to 2020.2011年至2020年美国接受长期透析或肾移植患者的阿片类药物处方
J Am Soc Nephrol. 2025 Jan 1;36(1):108-121. doi: 10.1681/ASN.0000000000000478. Epub 2024 Sep 3.
9
Exploring Opioid Prescription Patterns and Overdose Rates in South Carolina (2017-2021): Insights into Rising Deaths in High-Risk Areas.探索南卡罗来纳州的阿片类药物处方模式和过量用药率(2017 - 2021年):对高风险地区死亡人数上升的洞察
Healthcare (Basel). 2024 Jun 26;12(13):1268. doi: 10.3390/healthcare12131268.
10
Impact of opioid overdoses on US life expectancy and years of life lost, by demographic group and stimulant co-involvement: a mortality data analysis from 2019 to 2022.按人口群体和兴奋剂共同使用情况分析阿片类药物过量对美国预期寿命和寿命损失年数的影响:2019年至2022年死亡率数据分析
Lancet Reg Health Am. 2024 Jun 17;36:100813. doi: 10.1016/j.lana.2024.100813. eCollection 2024 Aug.
Epidemiology. 2018 Sep;29(5):707-715. doi: 10.1097/EDE.0000000000000858.
4
United States Life Tables, 2014.《2014年美国生命表》
Natl Vital Stat Rep. 2017 Aug;66(4):1-64.
5
The US Opioid Crisis: Current Federal and State Legal Issues.美国阿片类药物危机:当前联邦和州的法律问题。
Anesth Analg. 2017 Nov;125(5):1675-1681. doi: 10.1213/ANE.0000000000002403.
6
Geographic Variation in Opioid and Heroin Involved Drug Poisoning Mortality Rates.阿片类药物和海洛因涉及的药物中毒死亡率的地域差异。
Am J Prev Med. 2017 Dec;53(6):745-753. doi: 10.1016/j.amepre.2017.06.009. Epub 2017 Aug 7.
7
Heroin and fentanyl overdoses in Kentucky: Epidemiology and surveillance.肯塔基州的海洛因和芬太尼过量用药情况:流行病学与监测
Int J Drug Policy. 2017 Aug;46:120-129. doi: 10.1016/j.drugpo.2017.05.051. Epub 2017 Jul 18.
8
Fentanyl in the US heroin supply: A rapidly changing risk environment.美国海洛因供应中的芬太尼:迅速变化的风险环境。
Int J Drug Policy. 2017 Aug;46:107-111. doi: 10.1016/j.drugpo.2017.06.010. Epub 2017 Jul 20.
9
Relationship between Nonmedical Prescription-Opioid Use and Heroin Use.非医疗处方阿片类药物使用与海洛因使用之间的关系。
N Engl J Med. 2016 Jan 14;374(2):154-63. doi: 10.1056/NEJMra1508490.
10
The prescription opioid and heroin crisis: a public health approach to an epidemic of addiction.处方阿片类药物和海洛因危机:一种公共卫生方法应对成瘾的流行。
Annu Rev Public Health. 2015 Mar 18;36:559-74. doi: 10.1146/annurev-publhealth-031914-122957. Epub 2015 Jan 12.