• 文献检索
  • 文档翻译
  • 深度研究
  • 学术资讯
  • Suppr Zotero 插件Zotero 插件
  • 邀请有礼
  • 套餐&价格
  • 历史记录
应用&插件
Suppr Zotero 插件Zotero 插件浏览器插件Mac 客户端Windows 客户端微信小程序
定价
高级版会员购买积分包购买API积分包
服务
文献检索文档翻译深度研究API 文档MCP 服务
关于我们
关于 Suppr公司介绍联系我们用户协议隐私条款
关注我们

Suppr 超能文献

核心技术专利:CN118964589B侵权必究
粤ICP备2023148730 号-1Suppr @ 2026

文献检索

告别复杂PubMed语法,用中文像聊天一样搜索,搜遍4000万医学文献。AI智能推荐,让科研检索更轻松。

立即免费搜索

文件翻译

保留排版,准确专业,支持PDF/Word/PPT等文件格式,支持 12+语言互译。

免费翻译文档

深度研究

AI帮你快速写综述,25分钟生成高质量综述,智能提取关键信息,辅助科研写作。

立即免费体验

利用高斯误差函数和蒙特卡洛模拟对意大利新冠疫情时间演变进行数学预测。

Mathematical prediction of the time evolution of the COVID-19 pandemic in Italy by a Gauss error function and Monte Carlo simulations.

作者信息

Ciufolini Ignazio, Paolozzi Antonio

机构信息

1Dipartimento di Ingegneria dell'Innovazione, University of Salento, Lecce, and Centro Fermi, Rome, Italy.

2Scuola di Ingegneria Aerospaziale, Sapienza, University of Rome, Rome, Italy.

出版信息

Eur Phys J Plus. 2020;135(4):355. doi: 10.1140/epjp/s13360-020-00383-y. Epub 2020 Apr 15.

DOI:10.1140/epjp/s13360-020-00383-y
PMID:32309108
原文链接:https://pmc.ncbi.nlm.nih.gov/articles/PMC7156796/
Abstract

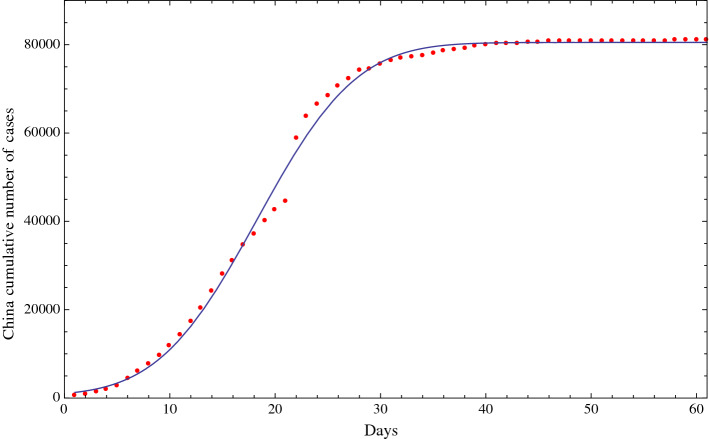
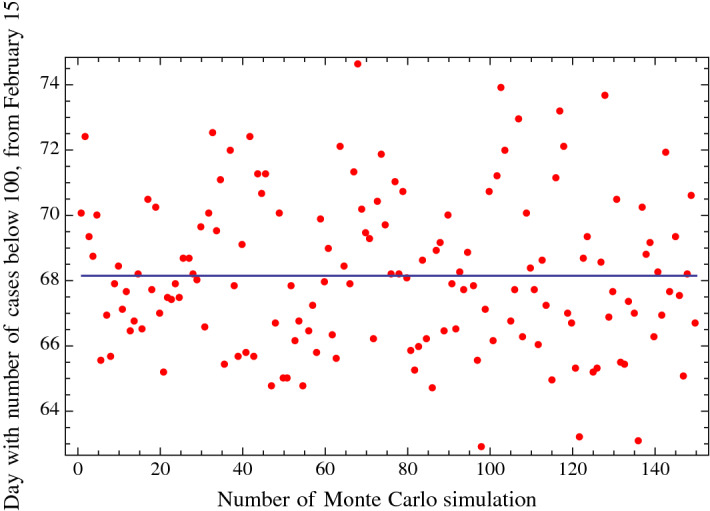
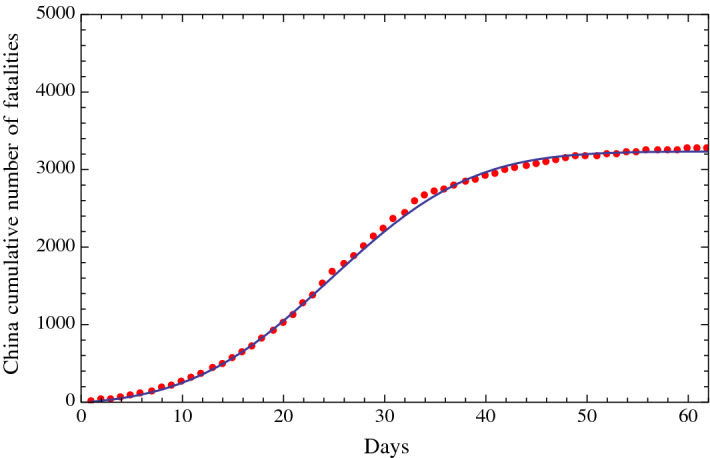
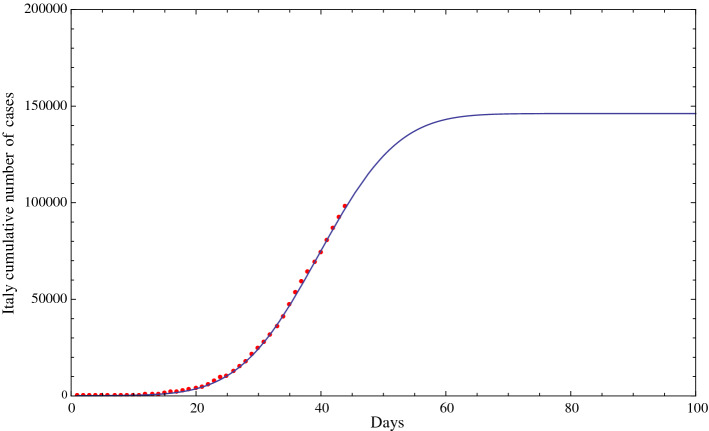
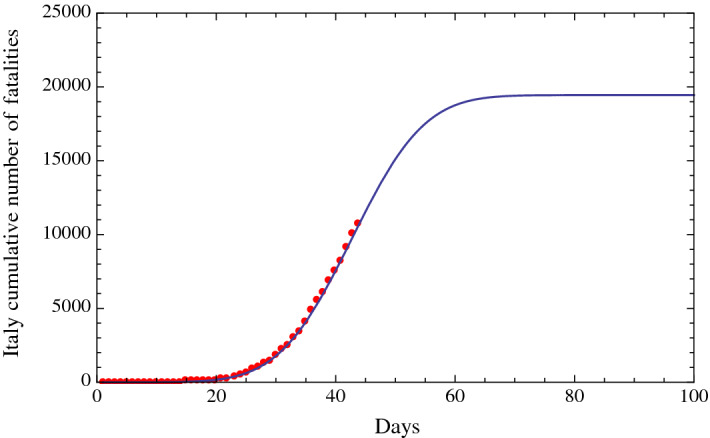
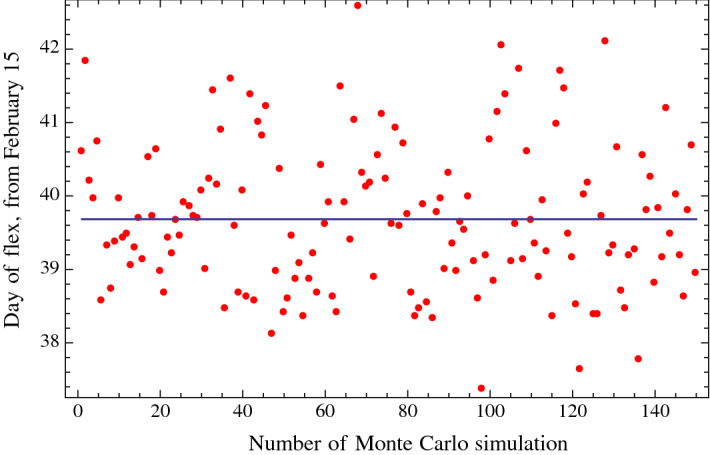
In this paper are presented mathematical predictions on the evolution in time of the number of positive cases in Italy of the COVID-19 pandemic based on official data and on the use of a function of the type of a Gauss error function, with four parameters, as a cumulative distribution function. We have analyzed the available data for China and Italy. The evolution in time of the number of cumulative diagnosed positive cases of COVID-19 in China very well approximates a distribution of the type of the error function, that is, the integral of a normal, Gaussian distribution. We have then used such a function to study the potential evolution in time of the number of positive cases in Italy by performing a number of fits of the official data so far available. We then found a statistical prediction for the day in which the peak of the number of daily positive cases in Italy occurs, corresponding to the flex of the fit, that is, to the change in sign of its second derivative (i.e., the change from acceleration to deceleration), as well as of the day in which a substantial attenuation of such number of daily cases is reached. We have also analyzed the predictions of the cumulative number of fatalities in both China and Italy, obtaining consistent results. We have then performed 150 Monte Carlo simulations to have a more robust prediction of the day of the above-mentioned peak and of the day of the substantial decrease in the number of daily positive cases and fatalities. Although official data have been used, those predictions are obtained with a heuristic approach since they are based on a statistical approach and do not take into account either a number of relevant issues (such as number of daily nasopharyngeal swabs, medical, social distancing, virological and epidemiological) or models of contamination diffusion.

摘要

本文基于官方数据,并使用具有四个参数的高斯误差函数类型的函数作为累积分布函数,对意大利新冠疫情阳性病例数随时间的演变进行了数学预测。我们分析了中国和意大利的现有数据。中国新冠确诊阳性病例累计数随时间的演变非常近似于误差函数类型的分布,即正态高斯分布的积分。然后,我们使用这样一个函数,通过对目前可用的官方数据进行多次拟合,来研究意大利阳性病例数随时间的潜在演变。然后,我们找到了意大利每日新增阳性病例数峰值出现日期的统计预测,该日期对应于拟合曲线的拐点,即其二阶导数符号的变化(即从加速到减速的变化),以及每日新增病例数大幅下降的日期。我们还分析了中国和意大利的累计死亡人数预测,得到了一致的结果。然后,我们进行了150次蒙特卡洛模拟,以对上述峰值日期以及每日新增阳性病例数和死亡人数大幅下降的日期进行更可靠的预测。虽然使用了官方数据,但这些预测是通过启发式方法获得的,因为它们基于统计方法,没有考虑到许多相关问题(如每日鼻咽拭子数量、医疗、社交距离、病毒学和流行病学)或污染传播模型。

https://cdn.ncbi.nlm.nih.gov/pmc/blobs/6765/7156796/052e53544fcb/13360_2020_383_Fig6_HTML.jpg
https://cdn.ncbi.nlm.nih.gov/pmc/blobs/6765/7156796/121c35058ff5/13360_2020_383_Fig1_HTML.jpg
https://cdn.ncbi.nlm.nih.gov/pmc/blobs/6765/7156796/ca29454af77b/13360_2020_383_Fig2_HTML.jpg
https://cdn.ncbi.nlm.nih.gov/pmc/blobs/6765/7156796/51b31eea297b/13360_2020_383_Fig3_HTML.jpg
https://cdn.ncbi.nlm.nih.gov/pmc/blobs/6765/7156796/8318ae199f36/13360_2020_383_Fig4_HTML.jpg
https://cdn.ncbi.nlm.nih.gov/pmc/blobs/6765/7156796/b14403fc70a8/13360_2020_383_Fig5_HTML.jpg
https://cdn.ncbi.nlm.nih.gov/pmc/blobs/6765/7156796/052e53544fcb/13360_2020_383_Fig6_HTML.jpg

相似文献

1
Mathematical prediction of the time evolution of the COVID-19 pandemic in Italy by a Gauss error function and Monte Carlo simulations.利用高斯误差函数和蒙特卡洛模拟对意大利新冠疫情时间演变进行数学预测。
Eur Phys J Plus. 2020;135(4):355. doi: 10.1140/epjp/s13360-020-00383-y. Epub 2020 Apr 15.
2
An improved mathematical prediction of the time evolution of the Covid-19 pandemic in Italy, with a Monte Carlo simulation and error analyses.通过蒙特卡洛模拟和误差分析对意大利新冠疫情时间演变进行的改进数学预测。
Eur Phys J Plus. 2020;135(6):495. doi: 10.1140/epjp/s13360-020-00488-4. Epub 2020 Jun 15.
3
Analysis of the prediction of the 2021 time-evolution of the Covid-19 pandemic in Italy using a Planck's distribution.利用普朗克分布对意大利2021年新冠疫情时间演变的预测分析。
Eur Phys J Plus. 2021;136(11):1167. doi: 10.1140/epjp/s13360-021-02145-w. Epub 2021 Nov 20.
4
Predictive model with analysis of the initial spread of COVID-19 in India.预测模型分析印度 COVID-19 的初始传播情况。
Int J Med Inform. 2020 Nov;143:104262. doi: 10.1016/j.ijmedinf.2020.104262. Epub 2020 Aug 25.
5
Transmission dynamics of Covid-19 in Italy, Germany and Turkey considering social distancing, testing and quarantine.考虑社交距离、检测和隔离措施下,意大利、德国和土耳其新冠病毒的传播动态
J Infect Dev Ctries. 2020 Jul 31;14(7):713-720. doi: 10.3855/jidc.12844.
6
Phenomenological Modelling of COVID-19 Epidemics in Sri Lanka, Italy, the United States, and Hebei Province of China.斯里兰卡、意大利、美国和中国河北省 COVID-19 疫情的现象学建模。
Comput Math Methods Med. 2020 Oct 18;2020:6397063. doi: 10.1155/2020/6397063. eCollection 2020.
7
Short-term forecast in the early stage of the COVID-19 outbreak in Italy. Application of a weighted and cumulative average daily growth rate to an exponential decay model.意大利新冠肺炎疫情早期的短期预测。加权和累积日均增长率在指数衰减模型中的应用。
Infect Dis Model. 2021;6:212-221. doi: 10.1016/j.idm.2020.12.007. Epub 2020 Dec 30.
8
A SIR-type model describing the successive waves of COVID-19.一个描述新冠疫情连续几波传播情况的SIR型模型。
Chaos Solitons Fractals. 2021 Mar;144:110682. doi: 10.1016/j.chaos.2021.110682. Epub 2021 Jan 14.
9
A SARS-CoV-2 Surveillance System in Sub-Saharan Africa: Modeling Study for Persistence and Transmission to Inform Policy.撒哈拉以南非洲的新冠病毒监测系统:关于持续存在和传播以指导政策的建模研究
J Med Internet Res. 2020 Nov 19;22(11):e24248. doi: 10.2196/24248.
10
First Wave of COVID-19 Pandemic in Italy: Data and Evidence.意大利的 COVID-19 大流行第一波:数据和证据。
Adv Exp Med Biol. 2021;1353:91-113. doi: 10.1007/978-3-030-85113-2_6.

引用本文的文献

1
Emergency decision support modeling for COVID-19 based on spherical fuzzy information.基于球形模糊信息的新冠肺炎应急决策支持建模
Int J Intell Syst. 2020 Nov;35(11):1601-1645. doi: 10.1002/int.22262. Epub 2020 Aug 18.
2
"Back to the future" projections for COVID-19 surges.对 COVID-19 疫情反弹的“回到未来”预测。
PLoS One. 2024 Jan 30;19(1):e0296964. doi: 10.1371/journal.pone.0296964. eCollection 2024.
3
Application and planning of an energy-oriented stochastic disassembly line balancing problem.面向能源的随机拆卸线平衡问题的应用与规划

本文引用的文献

1
Substantial undocumented infection facilitates the rapid dissemination of novel coronavirus (SARS-CoV-2).大量未记录的感染使新型冠状病毒(SARS-CoV-2)迅速传播。
Science. 2020 May 1;368(6490):489-493. doi: 10.1126/science.abb3221. Epub 2020 Mar 16.
2
Incubation periods of acute respiratory viral infections: a systematic review.急性呼吸道病毒感染的潜伏期:一项系统评价
Lancet Infect Dis. 2009 May;9(5):291-300. doi: 10.1016/S1473-3099(09)70069-6.
Environ Sci Pollut Res Int. 2023 May 24:1-15. doi: 10.1007/s11356-023-27288-4.
4
Seeing the forest and the trees: Holistic view of social distancing on the spread of COVID-19 in China.见树木更见森林:对中国社交距离对新冠病毒传播影响的整体看法
Appl Geogr. 2023 May;154:102941. doi: 10.1016/j.apgeog.2023.102941. Epub 2023 Mar 27.
5
Modelling epidemic growth models for lumpy skin disease cases in Thailand using nationwide outbreak data, 2021-2022.利用2021 - 2022年泰国全国疫情数据建立牛结节性皮肤病病例的流行增长模型
Infect Dis Model. 2023 Feb 20;8(1):282-293. doi: 10.1016/j.idm.2023.02.004. eCollection 2023 Mar.
6
The Pandemic Holiday Blip in New York City.纽约市的疫情假期短暂波动。
IEEE Trans Comput Soc Syst. 2021 Mar 19;8(3):568-577. doi: 10.1109/TCSS.2021.3058633. eCollection 2021 Jun.
7
A Robust Framework for Epidemic Analysis, Prediction and Detection of COVID-19.用于 COVID-19 的疫情分析、预测和检测的稳健框架。
Front Public Health. 2022 May 6;10:805086. doi: 10.3389/fpubh.2022.805086. eCollection 2022.
8
Advanced Computing Approach for Modeling and Prediction COVID-19 Pandemic.用于新冠疫情建模与预测的先进计算方法
Appl Bionics Biomech. 2022 Apr 14;2022:6056574. doi: 10.1155/2022/6056574. eCollection 2022.
9
A Bidirectional Long Short-Term Memory Model Algorithm for Predicting COVID-19 in Gulf Countries.一种用于预测海湾国家新冠疫情的双向长短期记忆模型算法
Life (Basel). 2021 Oct 21;11(11):1118. doi: 10.3390/life11111118.
10
Verification of the accuracy of the SIR model in forecasting based on the improved SIR model with a constant ratio of recovery to infection rate by comparing with monitored second wave data.通过与监测到的第二波数据进行比较,验证基于具有恒定康复与感染率比的改进SIR模型在预测方面的准确性。
R Soc Open Sci. 2021 Sep 22;8(9):211379. doi: 10.1098/rsos.211379. eCollection 2021 Sep.